
Comments of Gold Included
Below is a view centered around a six-month forward perspective on Bitcoin. We are taking into consideration Technical Indicators, Sentiment and Money Flows. Later in the writing, we add in Michael Howell’s “Declining Liquidity” outlook arrive at the most likely probabilities.
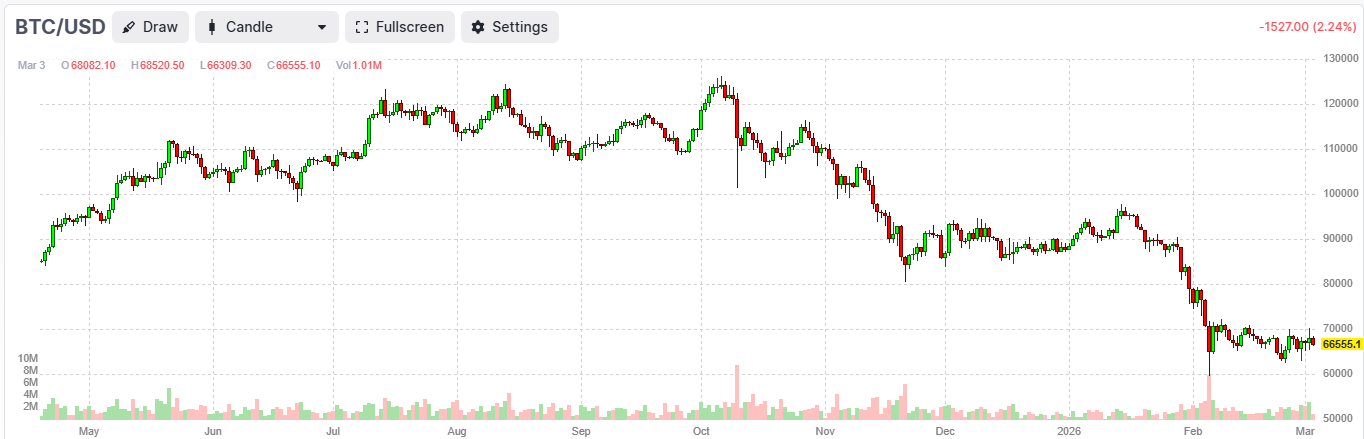
Bitcoin (BTC) is currently trading around $67,000–$68,000 (as of March 3, 2026), down ~47% from its all-time high of ~$126,200 in October 2025. It has been in a multi-month correction amid geopolitical tensions (including the ongoing US-Iran conflict), macro headwinds, and a broader risk-off environment. Here’s a structured breakdown from the three requested perspectives, followed by a synthesized 6-month outlook (through ~September 2026). This is not financial advice—crypto is highly volatile, and past patterns don’t guarantee future results.
1. Technical Perspective
Bitcoin remains in a post-peak corrective phase within the 2024–2025 bull cycle (which peaked in October 2025). Key observations:
- It has printed five consecutive red monthly candles since October 2025, forming a potential bear flag on higher timeframes with a measured downside target near $50,000 if it fully breaks.
- Immediate support cluster: $62,000–$65,000 (critical; a break could accelerate toward $55,000–$60,000). Resistance: $68,900–$70,000, then $71,300–$79,000.
- Oscillators are deeply oversold (weekly RSI at multi-month lows), Bollinger Bands are compressing (suggesting an imminent breakout), and there are bullish divergences forming.
- Short-term: Range-bound consolidation or relief bounce to $70k–$75k is the most probable path. Medium-term (next 6 months): Cycle analysis (traditional 4-year halving patterns) points to a potential cycle low sometime in 2026, but a breakout above $79k could invalidate the bearish structure and open the door to $90k+ recovery.
Technical takeaway: Neutral-to-bearish bias short-term (risk of retest lower), but setup is “spring-loaded” for a rebound if $60k–$62k holds.
2. Sentiment Perspective
Extreme Fear dominates. The Crypto Fear & Greed Index sits at 14 (Extreme Fear) as of March 3—down from 10 yesterday and 8 last week. This is among the lowest readings in recent years and historically acts as a contrarian buy signal (capitulation phase where weak hands exit).
- Retail/social sentiment has spiked positively on recent bounces (e.g., the quick recovery from a weekend dip to ~$63k), but overall remains cautious due to war-related risk aversion, U.S. tariff uncertainty, and elevated yields.
- On X (Twitter), recent discussions (late Feb–early March) show a split: many expect a near-term dip to $55k–$65k followed by accumulation, then a move toward $80k–$140k by late 2026. Long-term holders view current levels as a “hard floor” for organic recovery.
- Broader investor mood: Majority of buyers from the last two years are underwater, reducing selling pressure; fear of missing out (FOMO) is low, but institutional narratives (custody expansions by Citi, etc.) are building quietly.
Sentiment takeaway: Deeply pessimistic short-term (classic bottoming signal), with improving undertones as fear exhausts.
3. Money Flows Perspective
This is the most bullish of the three lenses right now. Institutional spot demand has reversed sharply after a rough stretch:
- U.S. spot Bitcoin ETFs saw ~$458 million net inflows on March 2 (one of the strongest single days of the quarter), with BlackRock’s IBIT alone pulling in $263M+. The prior week flipped to +$787 million net, ending five straight weeks of outflows (~$3.8B cumulative earlier in 2026).
- Cumulative ETF inflows since launch remain strongly positive (~$55B+), and institutions explicitly cited “global instability” (Iran tensions) as a reason for buying the dip—treating BTC as a portfolio diversifier.
- On-chain signals: Coinbase Premium Index flipped positive (first sustained U.S. institutional buying in ~40 days); large wallets (100+ BTC) are nearing record counts; MicroStrategy continues its weekly accumulation streak (now holding ~720k+ BTC). Whale exchange inflows have risen (some distribution pressure), but net spot demand from institutions and corporates outweighs it.
Money flows takeaway: Strong institutional rotation back in—spot buying is absorbing supply and providing a structural floor. This has historically preceded multi-month rallies.
Overall 6-Month Price Outlook (March–September 2026)
Base case (60–70% probability): $80,000–$95,000 by September.
- Technical rebound + Extreme Fear capitulation + sustained ETF inflows (especially if macro/geopolitical tensions ease) should drive a relief rally and range breakout. Consensus from analysts points to $75k+ by end-March as a stepping stone, with $90k+ plausible mid-cycle.
Bull case (20–25% probability): $100,000–$120,000+ if ETF inflows accelerate to $1B+ weekly averages, risk sentiment improves dramatically (e.g., de-escalation in Middle East), and BTC reclaims the 365-day moving average decisively.
Bear case (10–15% probability): $55,000–$65,000 (or lower) if the US-Iran conflict escalates sharply, broader recession signals emerge, or ETFs flip back to heavy outflows.
Key risks to watch: Prolonged war/risk-off flows, U.S. tariff/policy shocks, or a breakdown below $60k. Key catalysts: Continued ETF inflows >$300M/day, Coinbase premium staying positive, and a weekly close above $70k.
The dominant driver for upside over the next six months is the resurgent institutional money flows acting as a backstop while sentiment is at a fear extreme—historically a powerful combination. Monitor ETF daily flows and the Fear & Greed Index for early signals of shifts. Stay diversified and manage risk; the market can remain irrational longer than expected.
Recent Interview with Michael Howell of CrossBorder Capital (linked) March 2nd 2026
The Downcycle Begins, with Michael Howell, Founder at CrossBorder Capital
Michael Howell (CrossBorder Capital) remains firmly in the “liquidity-is-the-master-variable” camp, and his latest 2026 updates (as of late Feb/early March) are indeed very negative on the near-term outlook for global liquidity and risk assets. His Global Liquidity Index (GLI) shows the cycle has peaked and is now inflecting lower along its historical 65-month (~5–6 year) sine wave, with the next trough not until ~2027. Accelerating real-economy growth (strong US GDP, rising PMIs) is sucking liquidity out of financial markets into “Main Street” — a zero-sum dynamic that hurts speculative assets. He explicitly calls this a “liquidity vacuum” and warns 2026 will be “tough for risk assets.”
Howell’s Core Thesis vs. the Three Factors I Outlined Earlier (Technical, Sentiment, Money Flows)
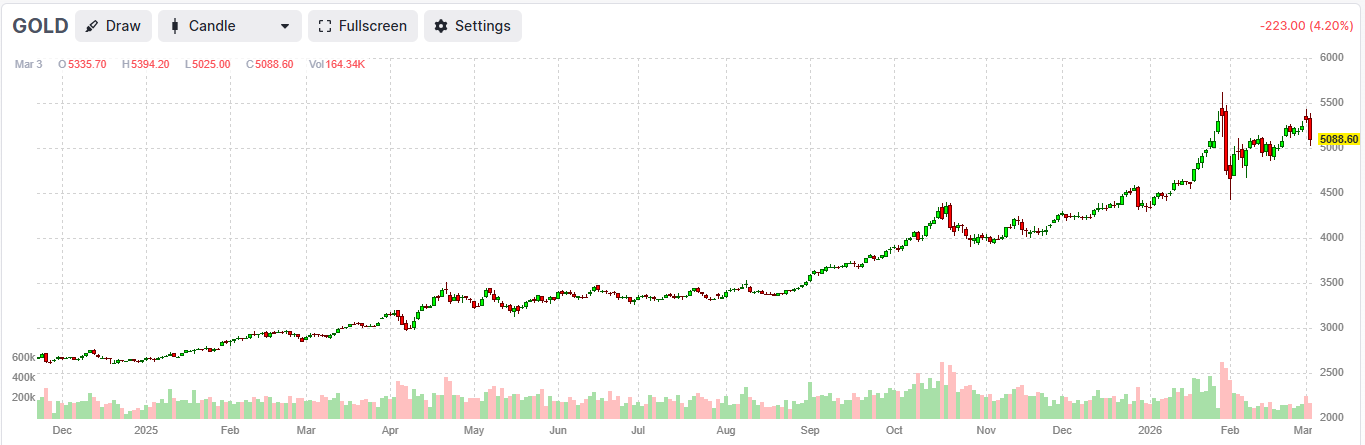
Howell’s framework gives liquidity ~40–45 % explanatory power over Bitcoin’s price moves (higher than gold). He treats BTC as a “liquidity sponge” and “canary in the coal mine” — it leads global liquidity turns by ~13 weeks. Gold, by contrast, is more supported right now by China-specific liquidity (PBoC stimulus, yuan-gold price surging) rather than US/financial flows.
| Factors from BTC analysis | Howell’s Liquidity View (2026) | Who Wins Short-Term (Next 6 Months)? |
|---|---|---|
| Technical (oversold, support $62–65k, spring-loaded rebound) | Liquidity downswing overrides; sell-off “isn’t over”; more likely skid toward $30k than $90k rally. Buy 20–25 % below trend (mid-$70ks area). | Howell ~55 % edge — macro cycle trumps short-term charts. |
| Sentiment (Extreme Fear at 14 — classic capitulation) | Acknowledges fear but says liquidity drain will exhaust it lower first. | Neutral / slight edge to contrarian factors — fear is already extreme, but he still sees lower lows. |
| Money Flows (record ETF inflows flipping positive, institutions buying the dip) | New ETF demand is real but untested in a full liquidity contraction; China liquidity bypasses BTC (crypto banned in stimulus channels); funds shift to real economy. | Money flows ~45 % counter-weight — strongest offset to Howell, but he argues it won’t be enough if Fed/private liquidity tightens further. |
Bottom line on the clash: Howell’s cycle work has a strong historical track record on macro turns. However, spot Bitcoin ETFs (now with >$55B cumulative inflows and daily institutional buying) are a structural change that didn’t exist in prior liquidity downswings. That creates a genuine tug-of-war.
Probabilities — Howell’s Liquidity Shrinkage vs. the Positive Factors
These are my synthesized probabilities (not financial advice; markets can deviate):
Bitcoin
- Probability Howell’s thesis dominates (liquidity contraction overrides ETF inflows/sentiment/technicals → further meaningful downside, e.g., retest $50–60k or toward $30k low sometime in the next 6 months): 50–55 %. The war/geopolitical risk-off environment and debt-refinancing pressures amplify his view.
- Probability the three positive factors prevail (sustained ETF inflows + extreme fear capitulation + technical rebound push toward $80–95k+ despite headwinds): 45–50 %. Inflows are absorbing supply aggressively right now and could blunt the worst of the downswing.
Net BTC 6-month range (updated from prior): $58k–$88k base case (wider volatility than before). Downside skew if liquidity contracts sharply; upside capped unless the GLI inflects higher sooner.
Gold
- Probability Howell’s framework drives strength/outperformance (China liquidity + safe-haven demand in war/uncertainty + debasement hedge → continued gains or clear outperformance vs. BTC): 70–75 %. He explicitly notes gold is benefiting from non-US liquidity sources that BTC isn’t capturing right now. Short-term gold/BTC correlation is negative; long-term positive.
- Gold remains his preferred tactical hedge alongside BTC (“load up on both, but buy on weakness”).
Key Takeaways & What to Watch
Howell is not permanently bearish on either asset — he still calls both “vital insurance policies” against long-term monetary inflation and recommends buying dips. His negativity is cyclical and tactical for 2026, not structural.
Monitor these for shifts:
- CrossBorder Capital’s Global Liquidity Index updates (or proxies: Fed balance sheet + China credit + global M2).
- US spot Bitcoin ETF daily flows (if they stay >$300–500M/day, they’re fighting Howell successfully).
- Gold vs. BTC relative performance (current divergence is exactly what his model predicts).
- Any Fed “Treasury QE” or repo stress signals (he flags these as potential triggers).
In the current US-Iran conflict environment, the safe-haven bid helps gold more than BTC, aligning with Howell. Bottom line: his liquidity work carries real weight and raises the downside risk for Bitcoin versus my prior base case, while reinforcing gold’s relative attractiveness. The ETF money flows are the main wildcard keeping the probabilities close to 50/50 on BTC.
Charts are from Finviz – an excellent source of charts, news flow, analyst views and company data screening.
LOTM Research & Consulting Service
* An account related to LOTM holds a position in this security.
Neither LOTM nor Tom Linzmeier is a Registered Investment Advisor.
Please refer to our web site for full disclosure at www.LivingOffTheMarket.com ZTA Capital Group, Inc.
To Unsubscribe please select “return” and type Unsubscribe in the subject line..
![]()