
S&P 500 (SPY) divided by Gold (GLD) is starting to roll-over based on the shorter-term moving averages. This means that the S&P 500 is doing less well than the price of gold. If you rotate between the S&P 500 and the Gold ETF (GLD), you would be starting the shift from (sell) the S&P 500 and into (buy) the physical gold ETF – GLD. With the price of the S&P 500/GLD indicator now below 50-day moving average, and the 20-day MA about to drop below the 50-day MA, the S&P 500 rally is now on a short-term sell signal and a buy GLD signal.
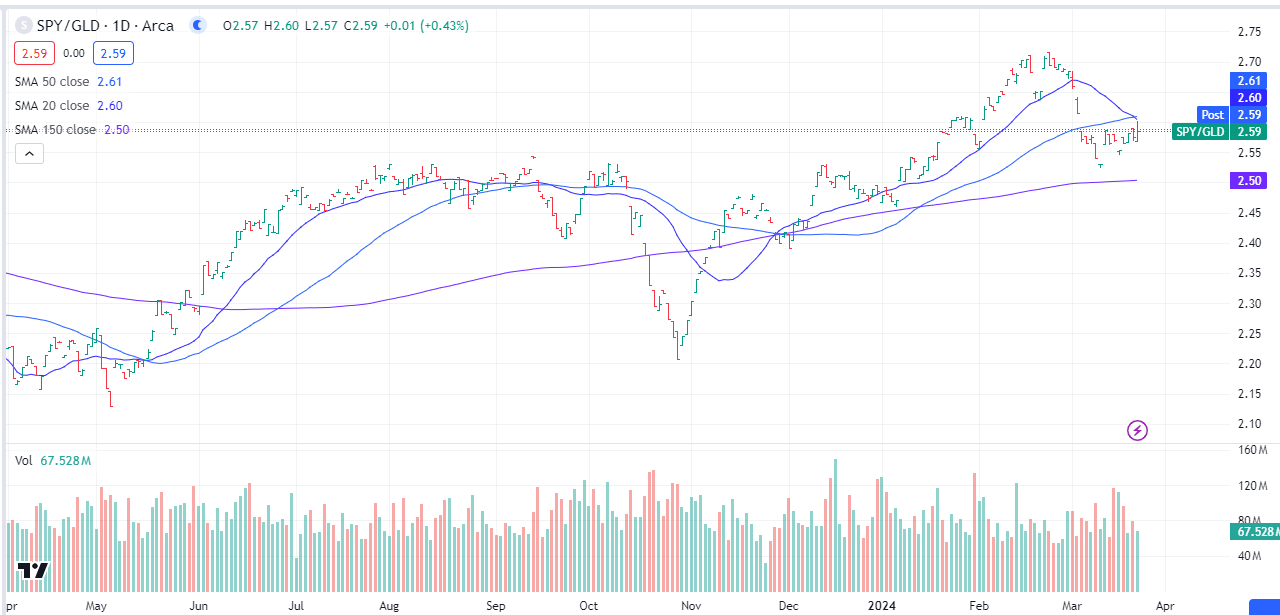
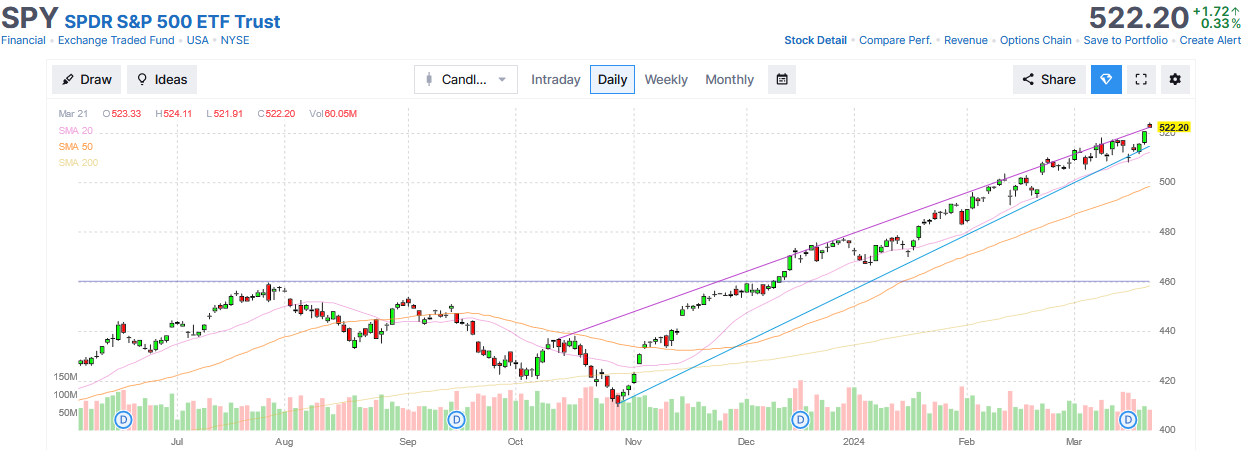
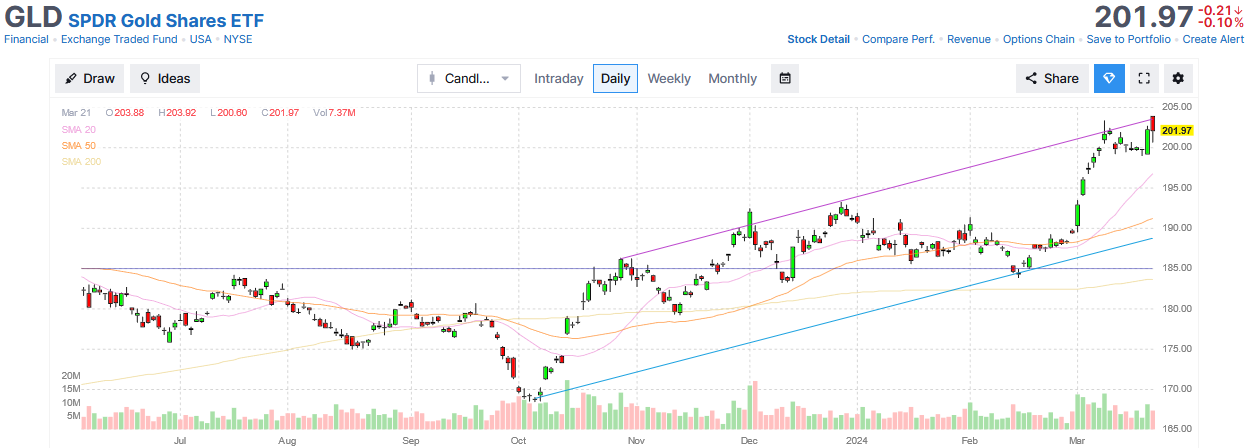
Below we share the individual S&P 500 chart in US Dollars and Gold chart In US Dollars, so you can view each one separately.
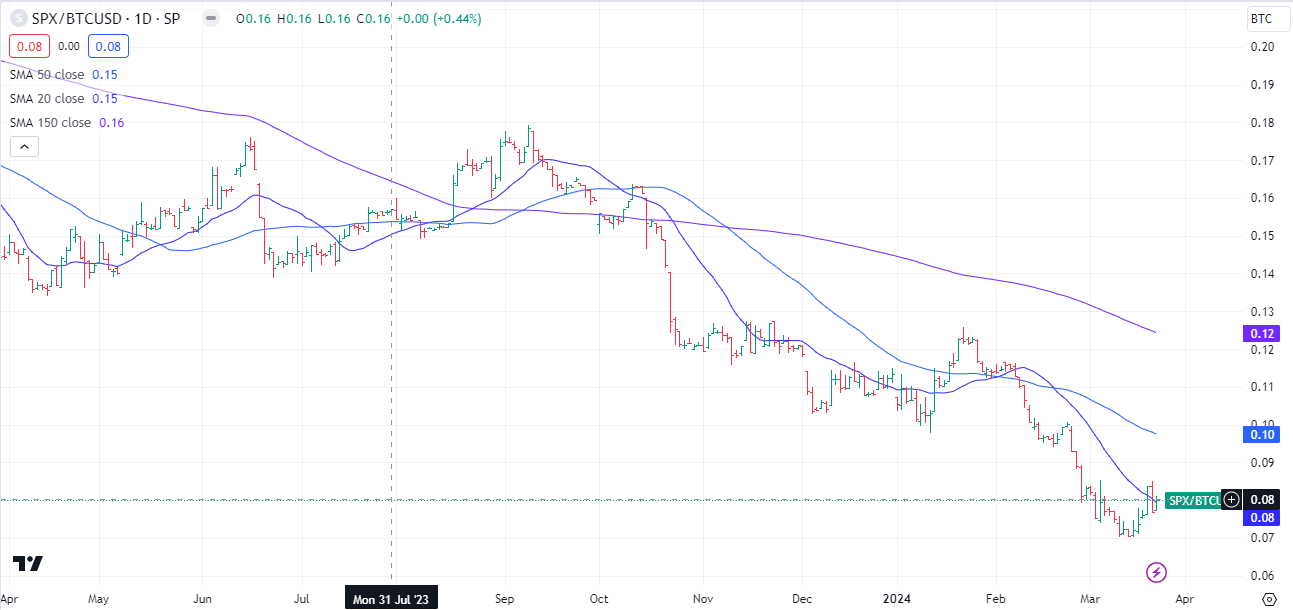
The chart above and the last chart are from TradingView.com and the two charts between are from Finviz.com.
Below is the S&P 500 (SPY) divided by Bitcoin (BTC)
Knowledge is Money. “Timely” Knowledge, is how you build Wealth
Available for Coaching, Training or Mentorships
Contact Tom by text to set a conversation at
Six five one – two four five – six six zero nine
LOTM Research & Consulting Service
* An account related to LOTM holds a position in this security.
Neither LOTM nor Tom Linzmeier is a Registered Investment Advisor.
Please refer to our web site for full disclosure at www.LivingOffTheMarket.com ZTA Capital Group, Inc.
To Unsubscribe please select “return” and type Unsubscribe in the subject line.
![]()