
Technical and Quantitative Market Readings
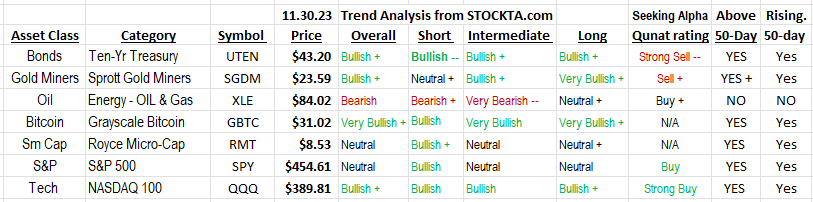
The prior published update was November 20, 2023. The Plus minus sign in the graphic above is the direction change from 11/20 to today.
Biggest gains in the market are made when one catches a money rotation from one asset class to another asset class. The biggest shift I see coming is a rotation into precious metals. In 2023, we have had a massive rally in crypto. GBTC* (above) has rallied from December 2, 2022 price of $8.98 to its current price of $31.02. Some of the smaller coins are up even more.
Physical gold, on a closing price basis is at a new all-time high – see long term chart below. Mining stocks are in the doldrums and barely reacting to the new high price of Physical gold. We believe this presents a very big upside opportunity.
We expect gold and silver miners price to play catch-up to the move to new highs in physical gold. Physical gold and silver are the end product of the miners. It is logical to assume that if inflation has peaked, meaning labor and energy costs are falling and the end product price is rising, then profit margins for miners will be expanding. Our world no longer seems to be operating in a logical way, so anything is possible. We believe the probabilities are high money will shift to the gold a silver miners.
Bond prices (above readings) are rising as interest rates are falling. This shows up in the trend number for bonds above. This trend could continue into 2024 – it is an election year after all. Falling inflation and falling interest rates are what the equity markets want. The current rally in equities reflect this anticipated trend. Looking out beyond the 2024 election, it is obvious to anyone who wants to look that governments globally are facing a situation where spending has reached levels past the ability to fund this spending. We favor hard assets such as oil, metals, property and crypto. Crypto is growing and breakneck speed and are a new asset class. Therefore, we believe the biggest appreciation will be from this asset class. Traditional assets such as oil property and metals are next on the best performer list. Avoid debt when owning or buying any of these assets.
Monthly chart of GLD (representing physical gold) showing the high prices of the last 18 years.
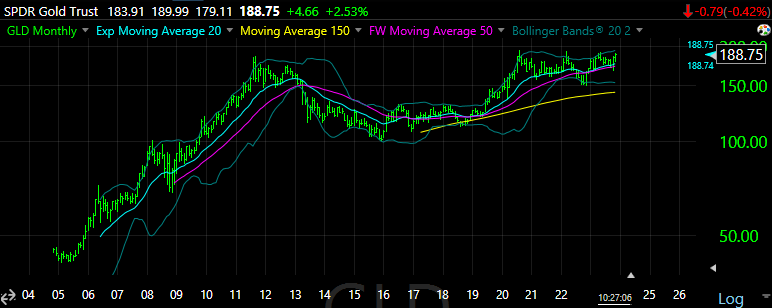
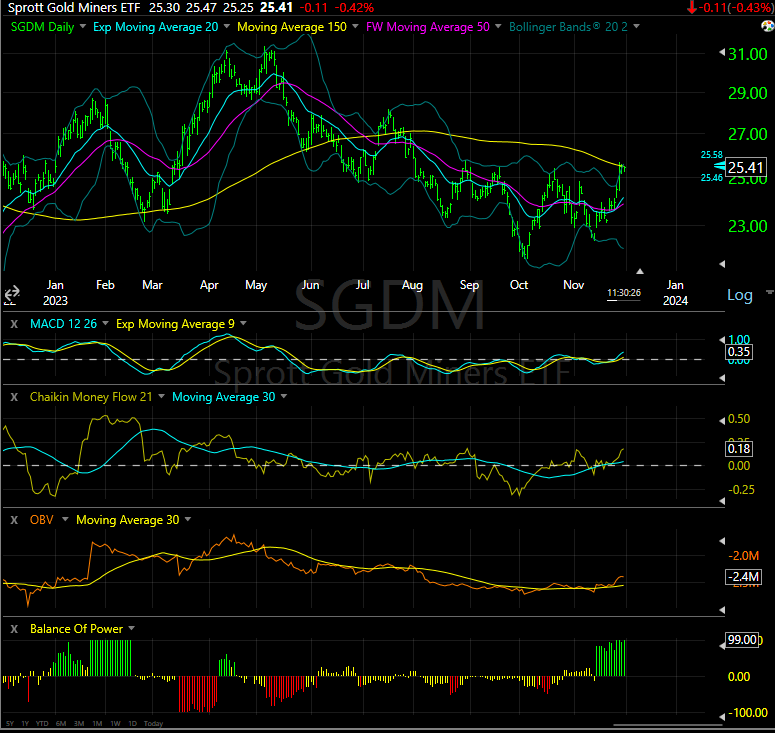
Chart of weekly Sprott Gold miner ETF (SGDM):
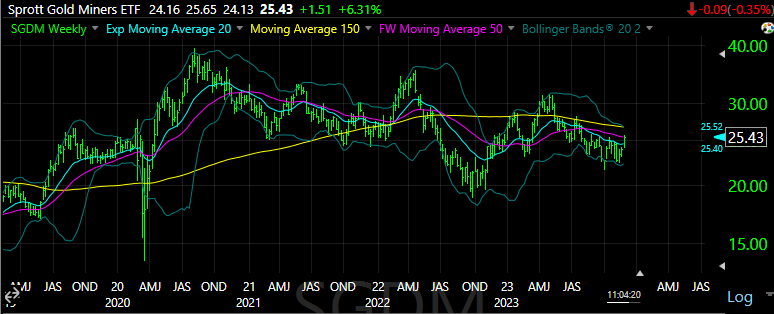
In the chart of the Sprott Gold Miners ETF (SGDM) below, we share out system of trend following. There is a nice triple bottom, reverse head & shoulders. One shoulder in Aug ’23 – the head in October ’23 and the second shoulder in mid-November ’23. A slight studder step and we’ll be off to the races before the end of December ’23.
See chart below to fit comments with the chart.
- The share price is now above the 50-day moving average.
- The 50-day moving average is rising.
- The 20-day MA is above the 50-day MA
- MACD is positive
- Two of three accumulation systems are positive. In this case all three are positive. CMF, OBV and BOP (balance of power.)
- William %R, not shown, is similar to MACD is a very short-term over bought / over solid indicator. It is currently short-term over bought. This corresponds to the share price having risen to its 150-day moving average and a likely resistance area. With everything else technically positive we believe it is just a question of days to weeks that the share price crosses above its 150-day moving average. This will bring in more buying as it is a trigger level that price is now on a long-term buy signal.
- The price is also at the top of the Bollinger Band suggesting a short-term hesitation in the upward price.
Both Bollinger Band and William %R are best used in daily trading or by swing traders. Our time frame here, is a three months to nine month buy signal.
Hope this is of help. We will try to get this “Technical and Quantitative Market Readings” report out each week on Friday mornings. Check back next week for the next update.
For Actionable Stock Ideas, consider a subscription to Tom’s LOTM Blog.
LOTM Style – We are more a controlled speculator, than diversified investor or short-term trader. We allow 100% loss/risk on some purchases. Often, we dollar-cost-average into losing positions. Volatility is our friend, not something to be feared. We let our winners win, as much as possible. We do not like paying taxes. We love value, yet watch charts. Our goal is to find value stocks that might double in one to three-years.
Written November 30, 2023, by Tom Linzmeier, for Tom’s LOTM Blog at https://lotm.substack.com/.
Accounts related to LOTM and Tom Linzmeier can & will, buy or sell securities at any time.
LOTM Research & Consulting Service
* An account related to LOTM holds a position in this security.
Neither LOTM nor Tom Linzmeier is a Registered Investment Advisor.
Consult your investment advisor for investment advice appropriate for your situation.
To Unsubscribe, please select “return” and type Unsubscribe in the subject line.
Tom’s LOTM Blog page https://lotm.substack.com/ .
![]()