
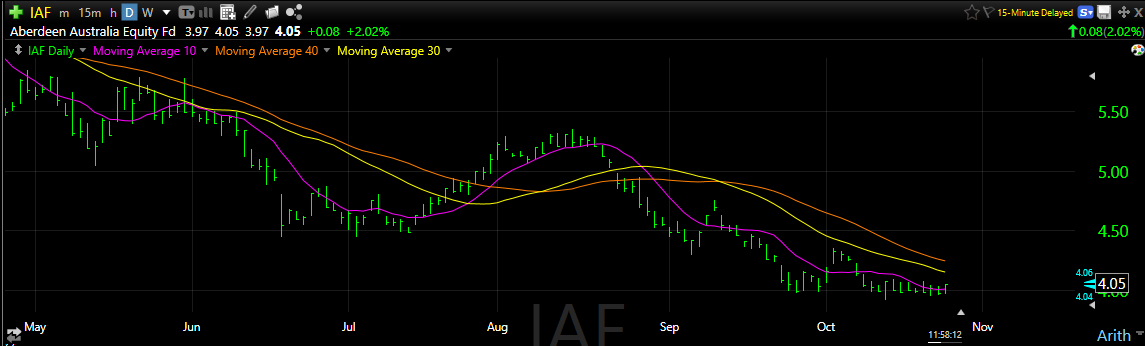
 Australia Equity Fund -13% dividend – IAF
IAF pays a dividend in the 11% area. About 25% of this fund is in healthy Australian Banks. About 25% of the portfolio is in mineral mining companies. Gold, silver, nickel, copper and iron ore. The down draft in the fund’s price is related to the rise in the US Dollar vs Australian currency as well as weakness in the mining stocks. Weakness in mining stocks is also related to a strong US Dollar as well.
When the US Dollar tops out and declines, I expect IAF to rally. At this moment, the strong US Dollar is causing problems in multiple countries’ currencies. China and Japan in SE Asia are two such currencies. In Europe, Switzerland, Italy, and England are in very difficult financial situations related to the US Dollar. We could see the US Fed take this into consideration in its Interest Rate Policy.
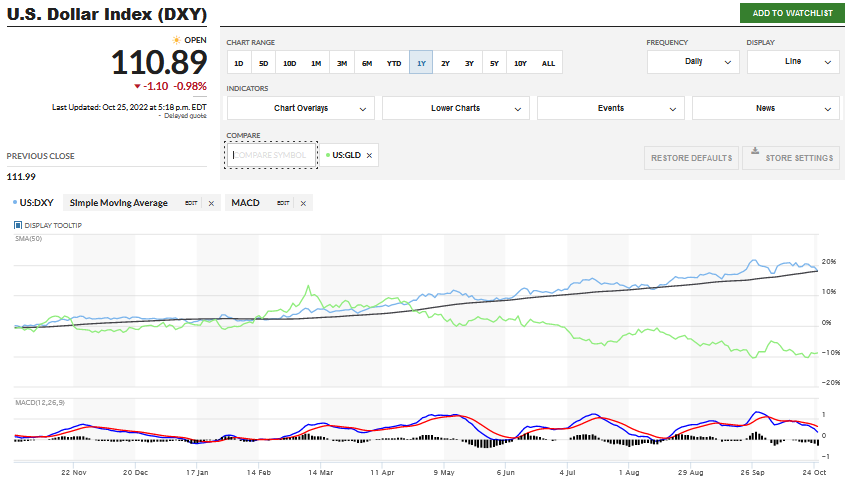
October 25, 2022: The US Dollar index (DXY) at MarketWatch is the quickest place to check the action of the US Dollar. The US Dollar is very close to crossing below its 50-day moving average as seen in the DXY chart below.
You are seeing gold and silver rally today, Oct 25th, as the DXY is starting to correct. The same is true for risk on assets, like Crypto.
Gold/Silver vs US Dollar have an inverse relationship that goes back decades. Carter Worth (CNBC technical analyst) in an interview with Daniela Cambone talks about this with charts from multiple time periods. The video was recorded last summer but what CW is discussing is a multiple years strategy and in its early stages of developing. He also discusses his opinion that the stock market will be out of favor for about eight years and that Gold has historically been the best performing asset class in similar periods of time. I strongly suggest watching this interview as a possible play book for the future. Carter is not the only person who is projecting this opinion that stocks are entering a prolonged period of underperformance.
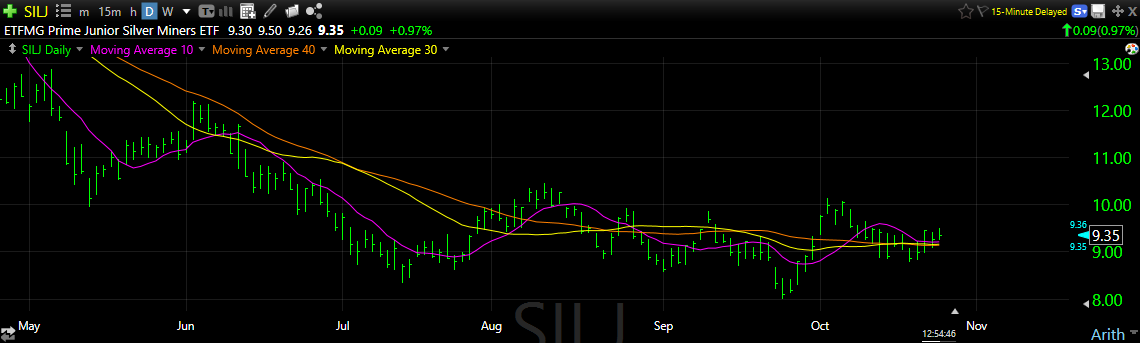
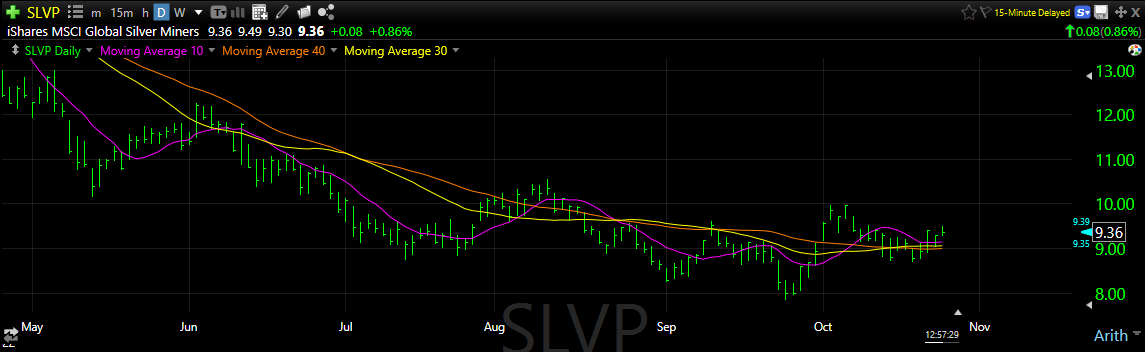
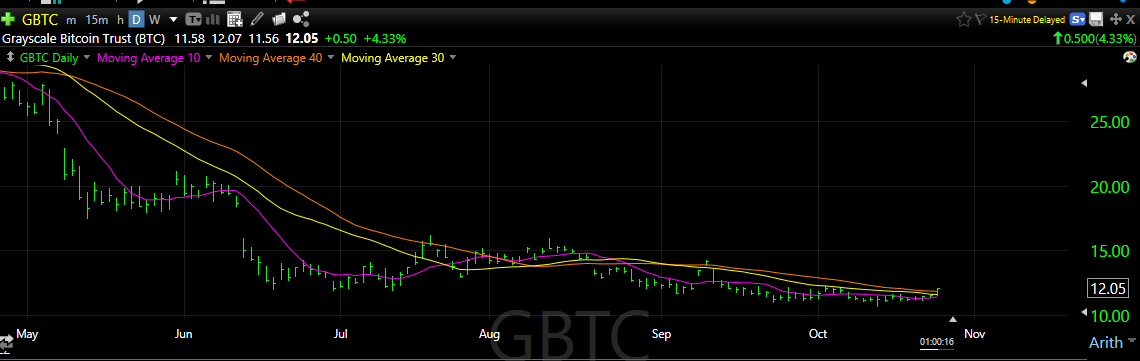
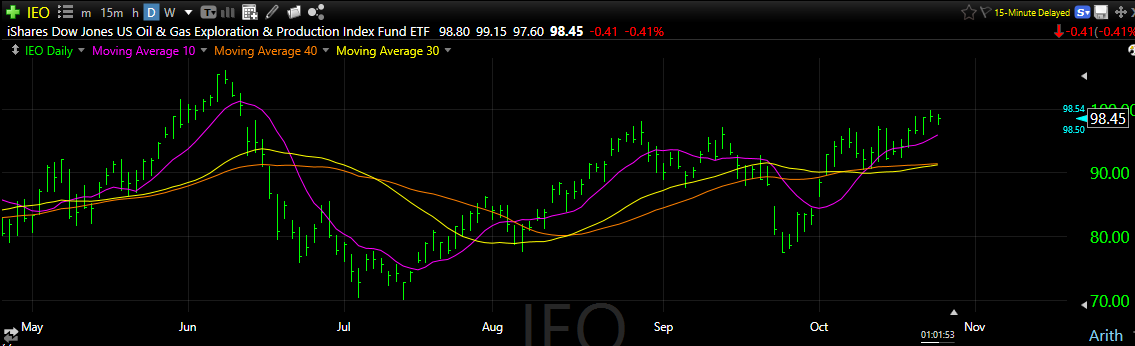
We will share additional charts from our weekly ETF Trading & Positioning project. The visual is the perspective, keeping in mind the theme of the US Dollar rising is a weight on these ETFs, and a declining US Dollar is a pully lifting the values in this selection of ETFs.
As we see in today’s chart today (above), the US Dollar appears close to dropping below its 50-day moving average, the charts below are strengthening from a base building period as the us dollar weakens. Cause and effect relationship.
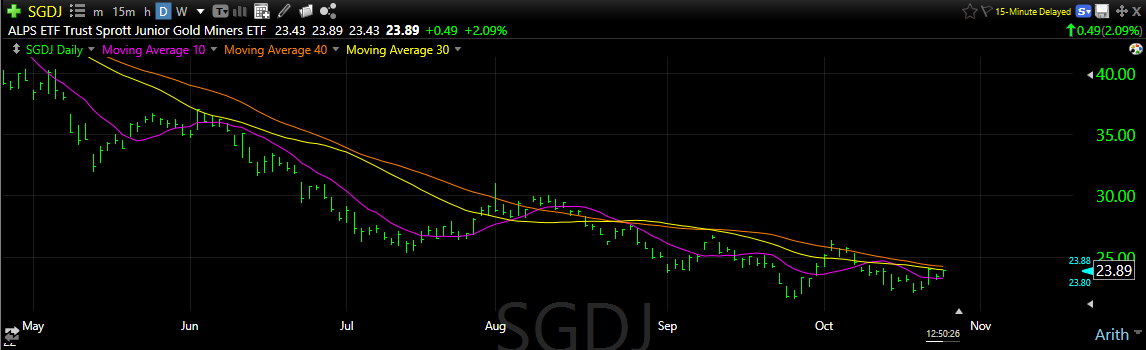
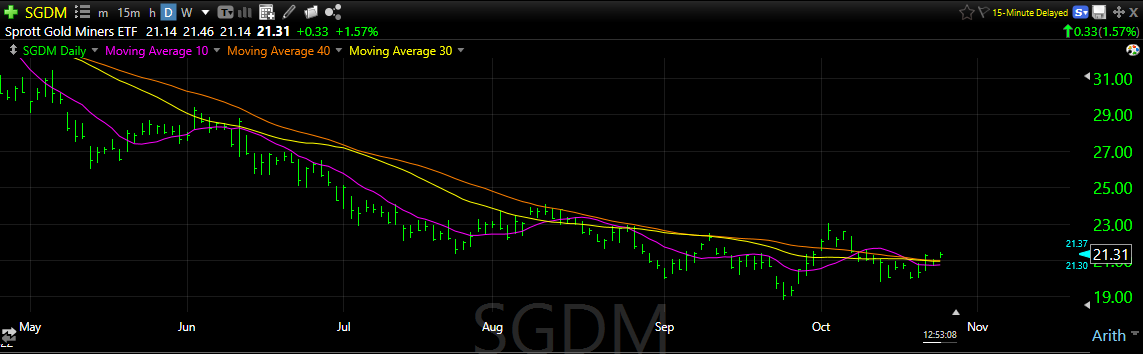
Sprott Small Cap Gold Miners Above. Sprott Large Cap Gold Miner Below.
Junior Silver Miners Below
iShares Large Cap Silver Miners Below
Grayscale Bitcoin ETF Below
iShares Oil & Gas Exploration ETF Below
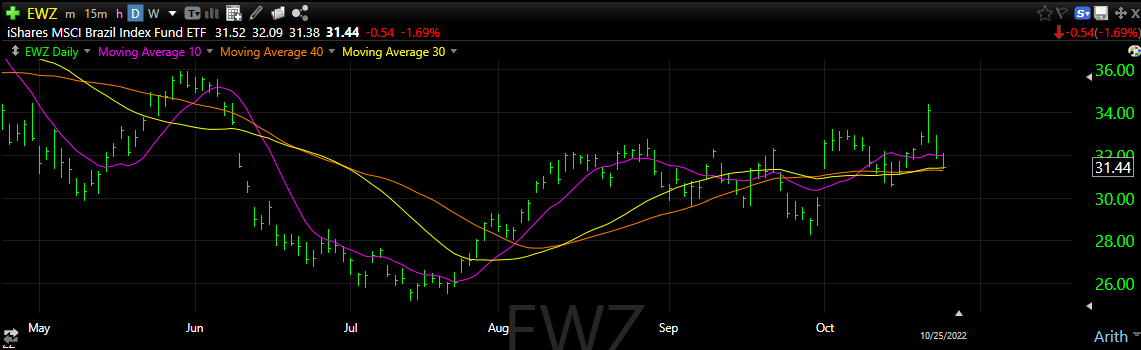
Brazil Large Cap ETF – EWZ Below
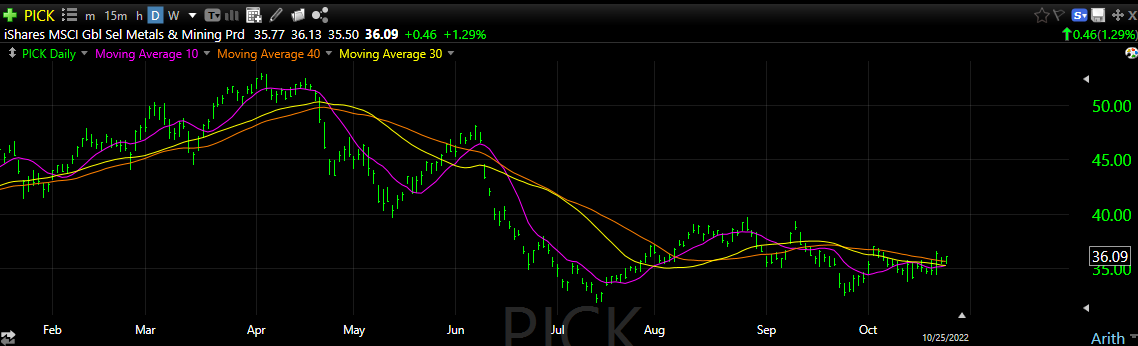
Global Select Metals & Mining ETF – PICK – Below
Below are supporting items as evidence to the LOTM Them that the decade of the 2020’s is a commodity decade.
- A technical analyst who is right more frequently than he is wrong, is the founder of The Market Traders.com, Chris Vermeulen: Stocks, real estate to correct even more, won’t see new highs for 10 years
Dated October 24, 2022, Video 33.34 minutes. Vermeulen projects a possible rally into year-end. Following that he is looking for either a multi-year sideways choppy market or the second leg down in 2023 to 2022’s first leg down correction. He does have positive areas for opportunities.
- Kitco Article on why Gold and Oil is an opportunity Now – a summary of a Goldman Sachs report.
Goldman on what oil and gold have to offer: this commodity is ‘welcome opportunity’
October 25, 2022, By Anna Golubova For Kitco News
EXCERPTS: Commodities are expected to offer returns of 12.8% in the next three months, 21.1% in the next six months, and 34.9% over the next 12 months, the note said, referring to the oil-heavy S&P GSCI Commodity Index.
The energy sector is projected to see returns of 46.7% over the next 12-month period, while industrial metals are expected to offer 29% and precious metals 23.8%.
Commodities have been underperformers year-to-date due to the aggressive tightening of monetary policies worldwide and growing global recession risks.
It appears a more active positioning or trading approach is desirable in the next 14 months. It is our mission to present you with actionable ideas for this shift from Passive investing to the old/new Active investing market. In addition to simply running ideas past you, we will try and explain the Why to what is developing so you have a greater confidence in making your investment decisions.
Consider subscribing to LOTM Daily Ideas and not missing any issues of our Blog!
We will go behind a pay wall, November 1, 2022.
The cost is a one-time payment of $239 for 14 months, ending Dec 31, 2023. That is a Monthly rate of $17.07.
Sign up through 1) Substack or
2) send a check payable to Access Vietnam Group.
Mailing address: Tom Linzmeier, 339 Summit Ave #4, Saint Paul, MN 55102.
3) Direct deposit by Zelle to US Bank, Access Vietnam Group, phone 651 245 6609.
Written October 25, 2022, by Tom Linzmeier, for LOTM: Tom’s Blog at https://lotm.substack.com/.
Accounts related to LOTM and Tom Linzmeier can & will, buy or sell securities at any time.
LOTM Research & Consulting Service
* An account related to LOTM holds a position in this security.
Neither LOTM nor Tom Linzmeier is a Registered Investment Advisor.
Consult your investment advisor for investment advice appropriate for your situation.
To Unsubscribe, please select “return” and type Unsubscribe in the subject line.
Tom’s LOTM Blog page https://lotm.substack.com/
![]()