
Technical Comment for Ten Producing Miners, Published September 9 linked at LivingOffTheMarket.com
- SilverCrest (SILV)*
- First Majestic (AG)
- Hudbay Minerals (HBM)
- Pan American Silver (PAAS)*
- Kinross Gold (KGC)
- Barrick (GOLD)
- B2 Gold (BTG)
- Newmont (NEM)
- Agnico Eagle (AEM)
- Lundin Mining (LUNMF)*
- Victoria Gold (VITFF)
- Karora Resources (KRRGF)* added to the list as our favorite Junior miner for comp purposes.
Our technical system is based on
- trend following basics of price crossing moving averages
- Moving averages crossing other moving averages.
- Relative strength (RS) Vs the overall market. Above the 50% line of all stocks and rising is positive. Rising trend is a plus and below and falling trend is a negative.
- MACD (Moving Average Convergent Divergent is a positive of negative based of line crossover.
- Chaikin Money Flow.
We will summarize each name based on the technical readings above but will only provide the visual chart for the share price and moving averages to keep the report concise.
SilverCrest (SILV)*
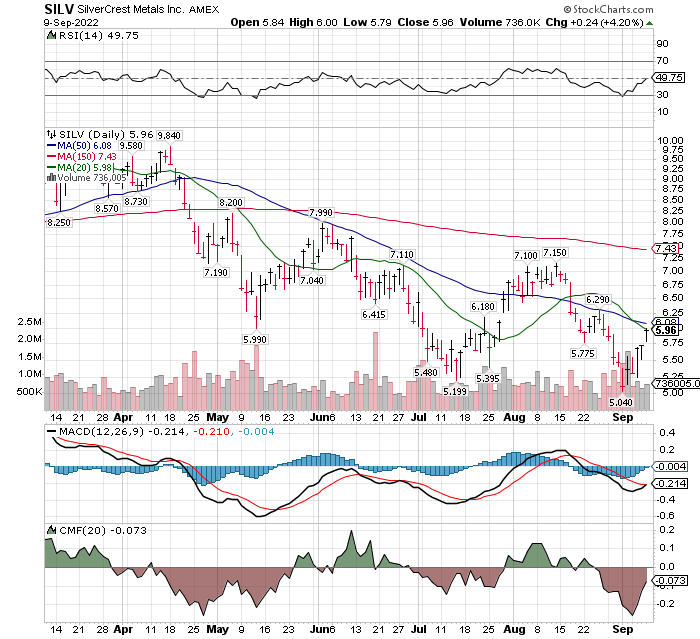
- Price crossing 50-day moving average – No but with-in pennies.
- Moving averages crossing other moving averages. No
- Relative strength (RS) Vs the overall market. rising and at 49.75 % – about to go positive.
- MACD – potential to go positive in one or two days if the price is positive.
- Chaikin Money Flow. Still negative but rising.
Comment: this could go on positive on four of five buy signals this week. We would be a buyer in anticipation.
First Majestic (AG)
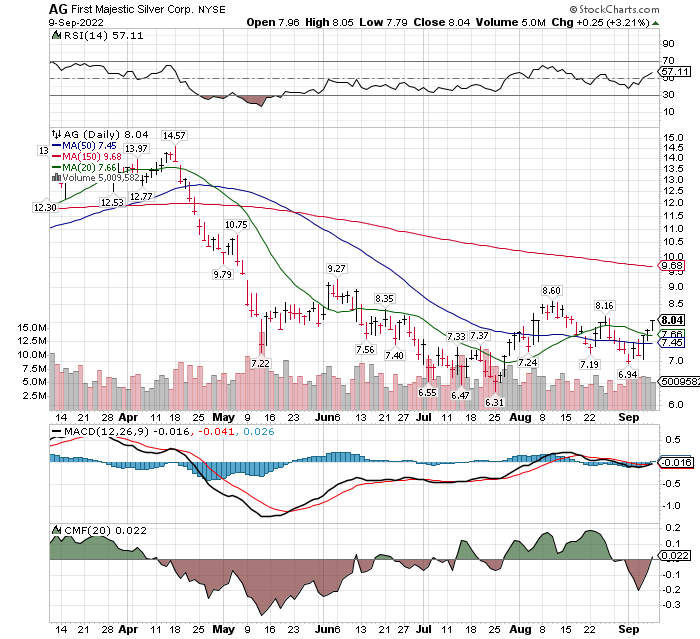
- Price crossing 50-day moving average – Yes
- Moving averages (MA) crossing – Yes 20-day above 50-day MA
- Relative strength (RS) Yes above 50% and rising.
- MACD – right at cross-over point.
- Chaikin Money Flow (CMF). Yes – just turned positive.
Comment: Yes, on an early buy signal.
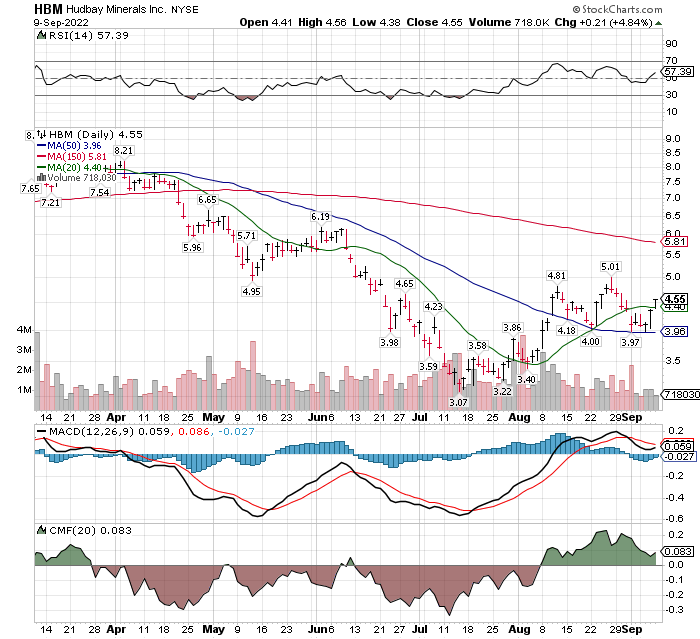
Hudbay Minerals (HBM)
- Price crossing 50-day moving average – Yes
- Moving averages (MA) crossing – Yes 20-day above 50-day MA
- Relative strength (RS) Yes above 50% and rising.
- MACD – No – not yet.
- Chaikin Money Flow (CMF). Yes.
Comment: Yes, on an early buy. A cup & handle chart formation and Double price bottom are positives.
Pan American Silver (PAAS)*
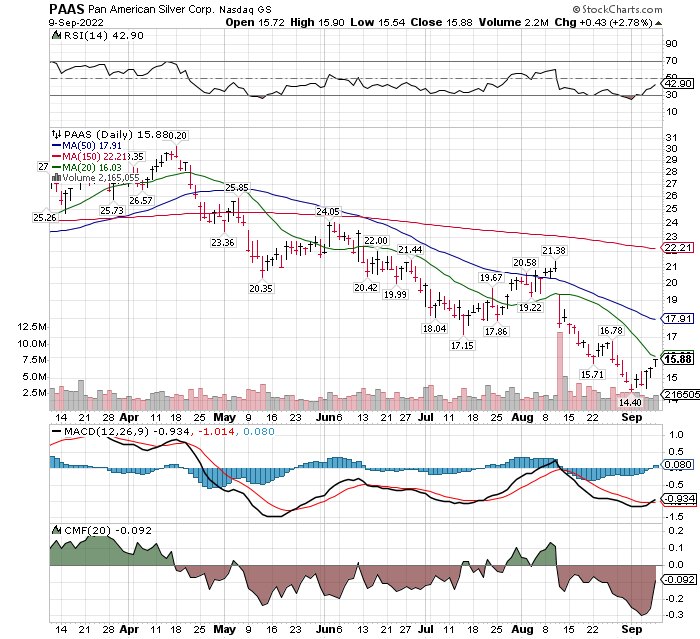
- Price crossing 50-day moving average – No
- Moving averages (MA) crossing – No
- Relative strength (RS) Rising but not above the 50% level.
- MACD – Yes
- Chaikin Money Flow (CMF). No
Comment: No. Not on a buy signal yet. Lagging the three above names in what might be an early buying into the Mining industry.
Kinross Gold (KGC)
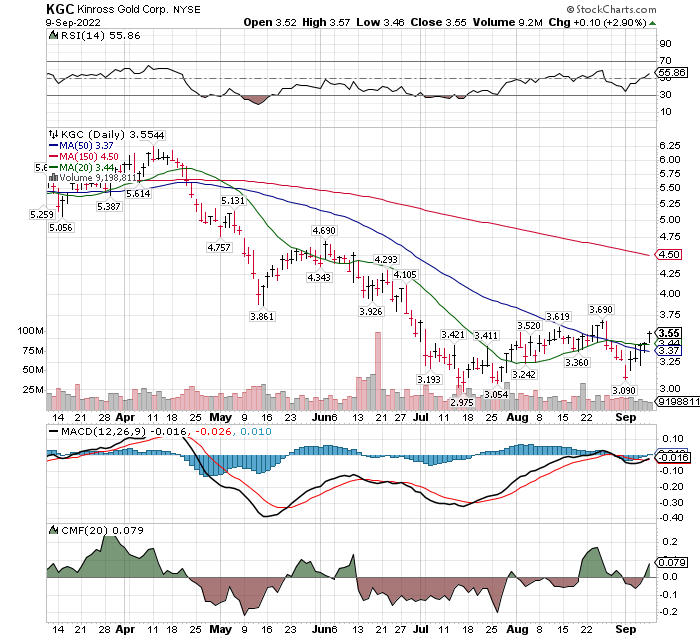
- Price crossing 50-day moving average – Yes
- Moving averages (MA) crossing – Yes 20-day is above the 50-day MA
- Relative strength (RS) Yes – Rising and above the 50% level.
- MACD – No, but likely cross-over this week.
- Chaikin Money Flow (CMF). Yes
Barrick Gold (GOLD)
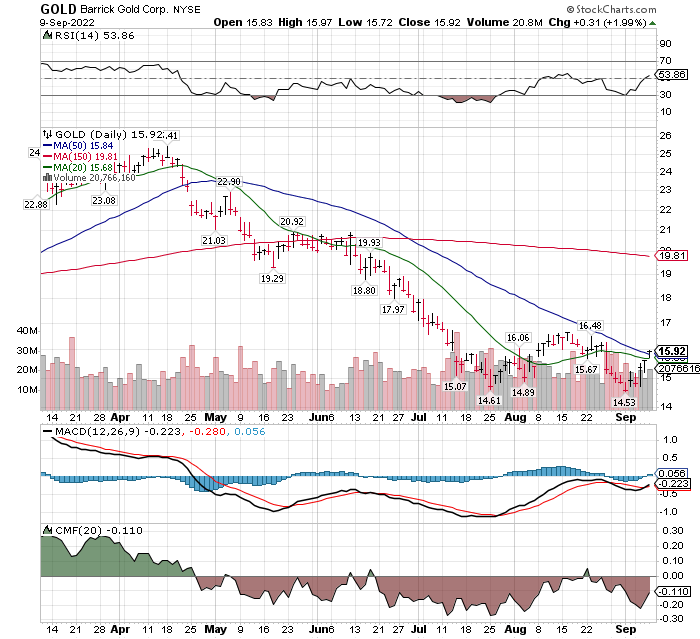
- Price crossing 50-day moving average – Yes
- Moving averages (MA) crossing – No
- Relative strength (RS) Yes – Rising and above the 50% level.
- MACD – No, but likely cross-over this week.
- Chaikin Money Flow (CMF). No but improving
Comment: Improving but not yet on a majority of signals. Can buy based on Valuation and Dividend.
B2 Gold (BTG)
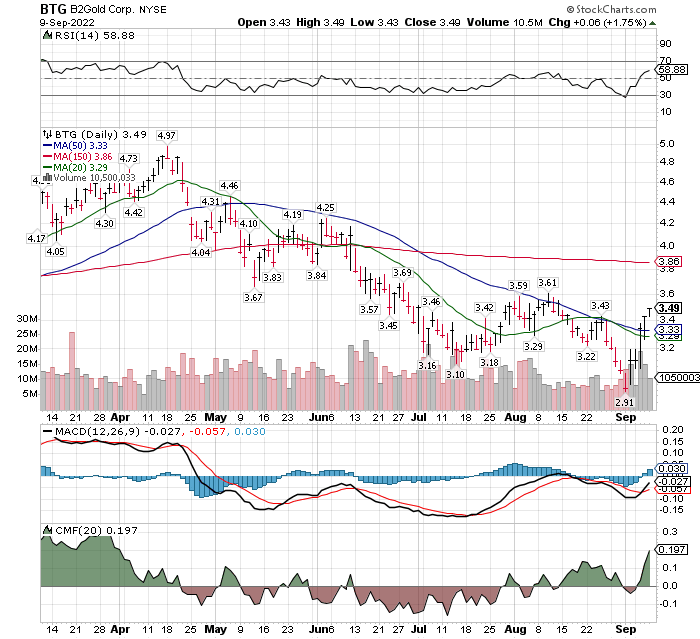
- Price crossing 50-day moving average – Yes
- Moving averages (MA) crossing – No – Probable in the next week.
- Relative strength (RS) Yes – Rising and above the 50% level.
- MACD – Yes
- Chaikin Money Flow (CMF). Yes
Comment: Buy signal on. The first two or three day price pop above a 50-day MA, usually leads to a pull-back to test the breakout. If interested in this name, look to buy into weakness to and even slightly below the 50-day MA now at $3.33.
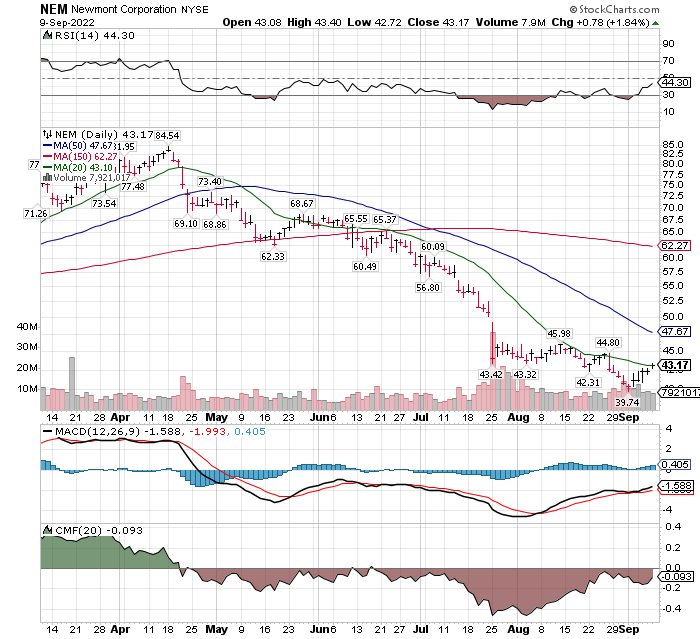
Newmont (NEM)
- Price crossing 50-day moving average – No
- Moving averages (MA) crossing – No
- Relative strength (RS) No Rising but not above the 50% level.
- MACD – Yes
- Chaikin Money Flow (CMF). No but close.
Comment: Can buy based on fundamentals and dividend, but not on technical analysis. Summary with three charts left to check.
- Let’s see if this observation holds. It appears money is starting for flow into the sector, but the biggest Gold companies are lagging Silver & Copper and Smaller Cap Names.
Agnico Eagle (AEM)
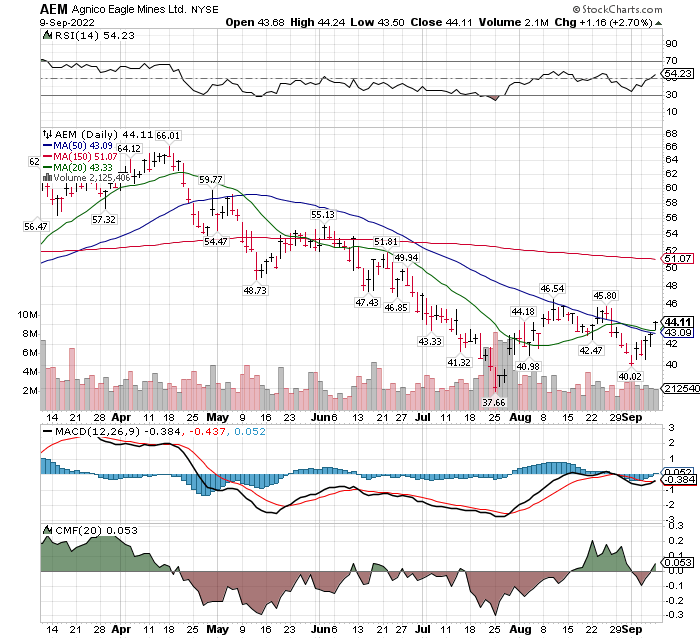
- Price crossing 50-day moving average – Yes
- Moving averages (MA) crossing – No but likely this week.
- Relative strength (RS) Yes – Rising and above the 50% level.
- MACD – No but looks like it will this week.
- Chaikin Money Flow (CMF). Yes, positive.
Comment: Yes, I would buy now. Miners’ prices can move fast, and seasonality is in their favor (strong price season (October thorough January). Agnico is the best of the best gold miners IMO, so I have no issue buying in at this low.
Lundin Mining (LUNMF)*
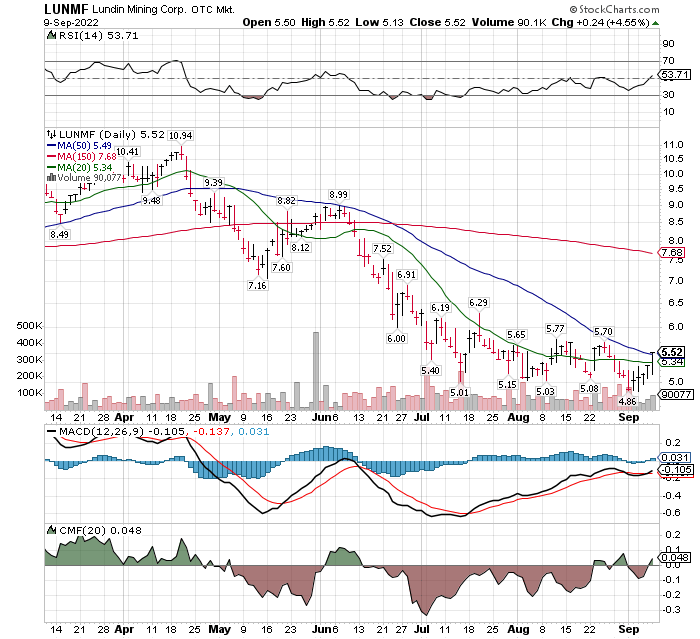
- Price crossing 50-day moving average – Yes, just barely on Friday.
- Moving averages (MA) crossing – No but likely this week.
- Relative strength (RS) Yes – Rising and above the 50% level.
- MACD – Yes, just barely this past Friday.
- Chaikin Money Flow (CMF). Yes, Just this week.
Comment: Accounts related to LOTM bought shares of Lundin this past week. We bought for the low trailing P/E of 5 and the dividend of 5.5%. Technically it is just shifting onto a trading buy position.
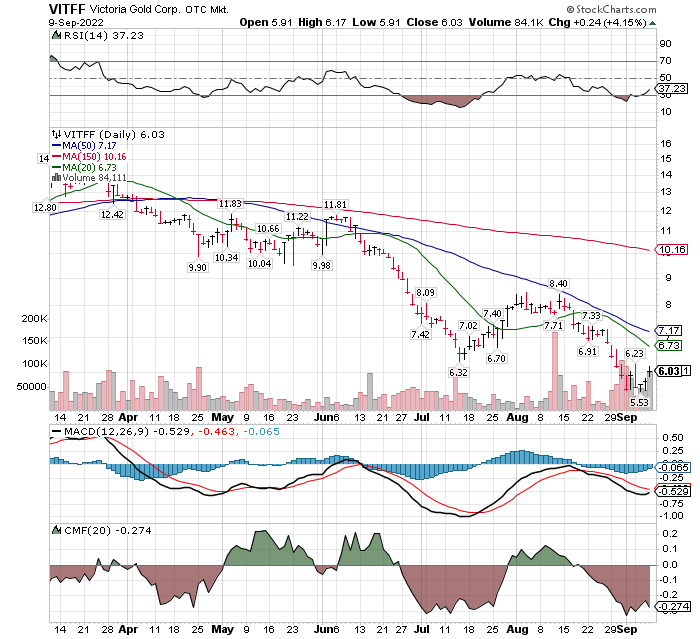
Victoria Gold (VITFF)
- Price crossing 50-day moving average – No.
- Moving averages (MA) crossing – No.
- Relative strength (RS) No
- MACD – Yes, just barely this past Friday.
- Chaikin Money Flow (CMF). Yes, Just this week.
Comment: Technically VITFF is not on a trading buy signal. It is cheap on a normalized valuation basis. If the industry is on a Rally Phase, then VITFF has potential in being a lagging stock within the overall rally. Victory is a takeover target company. If it does not move up in price, then with other mining companies trading at higher valuations it might be a more desirable take-over target. Very little risk in Victoria price at the current price.
Karora Resources (KRRGF)
Not in our first report is Karora. We were looking for bigger companies in the first report but since Karora is our favorite Gold and Nickel miner and many of you own Karora we decided to add it to the list of miners with a technical opinion.
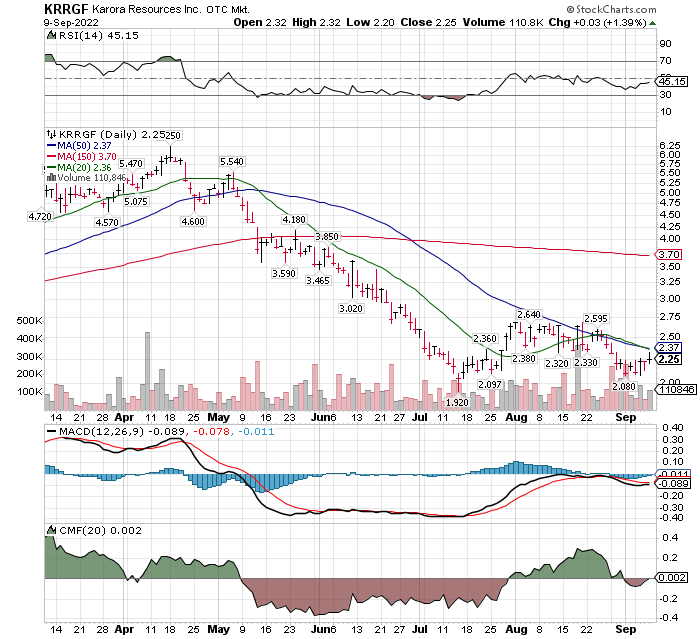
- Price crossing 50-day moving average – No.
- Moving averages (MA) crossing – No.
- Relative strength (RS) No, but rising
- MACD – No but very close.
- Chaikin Money Flow (CMF). No but very close.
Comment: Karora is lagging the industry movers. It is up about 20% to 25% from its lows. We have little concern about Karora’s lagging the industry. Karora is our biggest dollar position within the gold, silver and copper miners.
It is our hope that by sharing a constant set of technical analysis metrics that you can learn and become comfortable with a system of viewing companies from a technical analysis perspective. Hopefully you can use this methodology independently in your personal analysis.
Technical analysts who do market cycle studies (Larry Williams and Charles Nenner Research interviews) are projecting a bit of a pull back into the middle of October. At that point they become aggressively bullish on the market going into 2022 year-end. Miners, especially gold and silver typically have a strong seasonality from the October through January period.
Charles Nenner, in his very longer-term cycles, projects we have started a 30 to 35 year cycle of rising inflation, rising interest rates, and rising conflict both domestic and international. Considering that in 1982, we started a 40 year deflationary cycle that had interest rates drop from 18.5% in the USA to 0.25% by 2021, his projection fits with his long term cycle studies pattern. In his cycle studies, gold and precious metals are in a rising price cycle until 2027. Nenner does forecast the end of the American Empire and the Rise of SE Asia – particularly India. Quite disturbing if living in the USA. Nenner does not live in the USA so might be more objective than those of us living in the USA.
Larry Williams in his cycle studies is projecting that money printing has little to do with inflation rates but rather Inflation lags stock market performance, based on his studies of historical correlations. Since the stock market decline started in January, he projects inflation will fall significantly in September, October or November. Williams is also bullish on Equities starting in mid-October.
We find Nenner studies very interesting. LOTM is suggesting over-weight positioning in precious metals and base metals because they are very cheap when compared to other potential investments like Real Estate, Equities and Bonds. Let’s see how Nenner’s near term projections turn out before giving more credit to his longer-term projection. In the crazy world we live in today, we believe all possibilities should be considered and held as a possibility. As different possibilities fall by the wayside, or gain momentum, we will adapt and adjust accordingly.
Inflation numbers are expected to fall dramatically in October and November. At the same time economic numbers are also expected to fall dramatically.
Peace, happiness and prosperity to all.
Sept 11, 2022, written by Tom Linzmeier for Tom’s Blog at www.LivingOffTheMarket.com
LOTM Research & Consulting Service
* An account related to LOTM holds a position in this security.
Neither LOTM nor Tom Linzmeier is a Registered Investment Advisor.
Please refer to our web site for full disclosure at www.LivingOffTheMarket.com ZTA Capital Group, Inc.
To Unsubscribe please select “return” and type Unsubscribe in the subject line.
![]()