
Sourced from MarketWatch
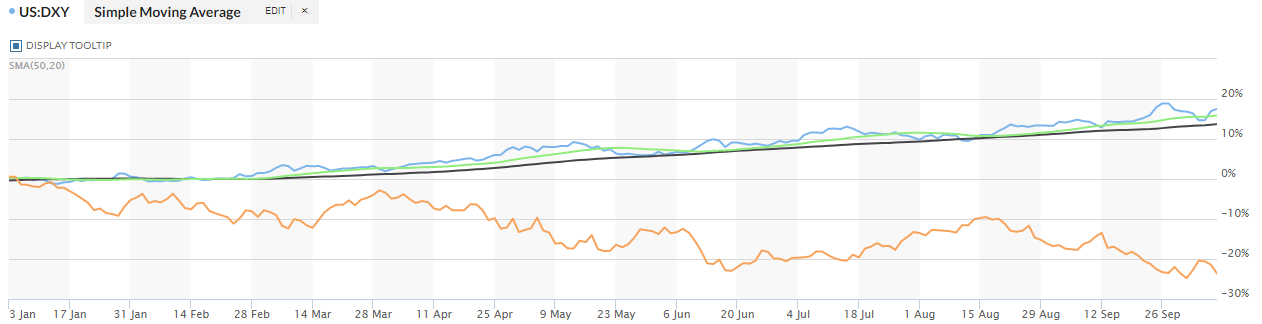
This week was a great example of Dollar down/stocks-up on Monday and Tuesday with Thursday and Friday being Dollar-up/stocks down. Cannot show the correlation any clearer.
In the upper case red/green/black lines above we have green-20-day MA, blue-the US Dollar and black-being the 50-day MA. Most algorithms use price crossing moving average (MA) and MA crossing other MA as buy sell signals.
The orange line is the S&P 500 (SPY).
Measuring the scale on the right hand side we see the percent increase in the us dollar and the decline in the spy in the same period.
We can observe the rally in the SPY happened during periods of decline in the us dollar. The dollar crossing below the 20-day moving average we can observe the reaction in the SPY price. Because this action reaction in the dollar to spy we now have buying when dollar falls but also selling short in the market when the dollar rises.
As an accelerant (like gasoline on a fire), we can now add the buying in (closing) of short positions a close time proximity we have the selling short activity. This helps account for this week’s volatility where three of five days this week being more than 700 point moves.
Ten Year Treasury:
The ten year treasury and the US Dollar are front runners to the Federal reserves actions with Fed Funds. It is stated (by Jerome Powell) Fed Policy goal is that interest rates are to be above the 4% level. Fed Funds and
2-year through 10-year treasuries. 4.25% by January of 2023 is that target. Currently, Fed Funds are at 3% to 3.25%. Two more rate hikes to go to hit their goal by the January time period.
The two-year treasury is at 4.2%. The ten-year treasury is at 3.83%. the ten-year has been above 4 percent.
Just looking at Fed Funds and the 2 & 10-year treasury, you can see 4% is priced into the market through the treasuries. This is why multiple analysts are saying the market lows are in. You have to decide your own comfort level with the data.
The link right now between the US Dollar and the Ten-year treasury note is in harmony. Ten-year Treasury up, US Dollar up. Ten-year-Treasury down, US Dollar down.
The next chart is the S&P 500 (SPY) divided by the Ten-year Treasury with a 50-day moving average. The chart was keep simple and uncluttered so you can clearly see the relationship between the 50-day and the ratio of SPY/Ten-year treasury. Do you think there are a few algorithms using this combination?
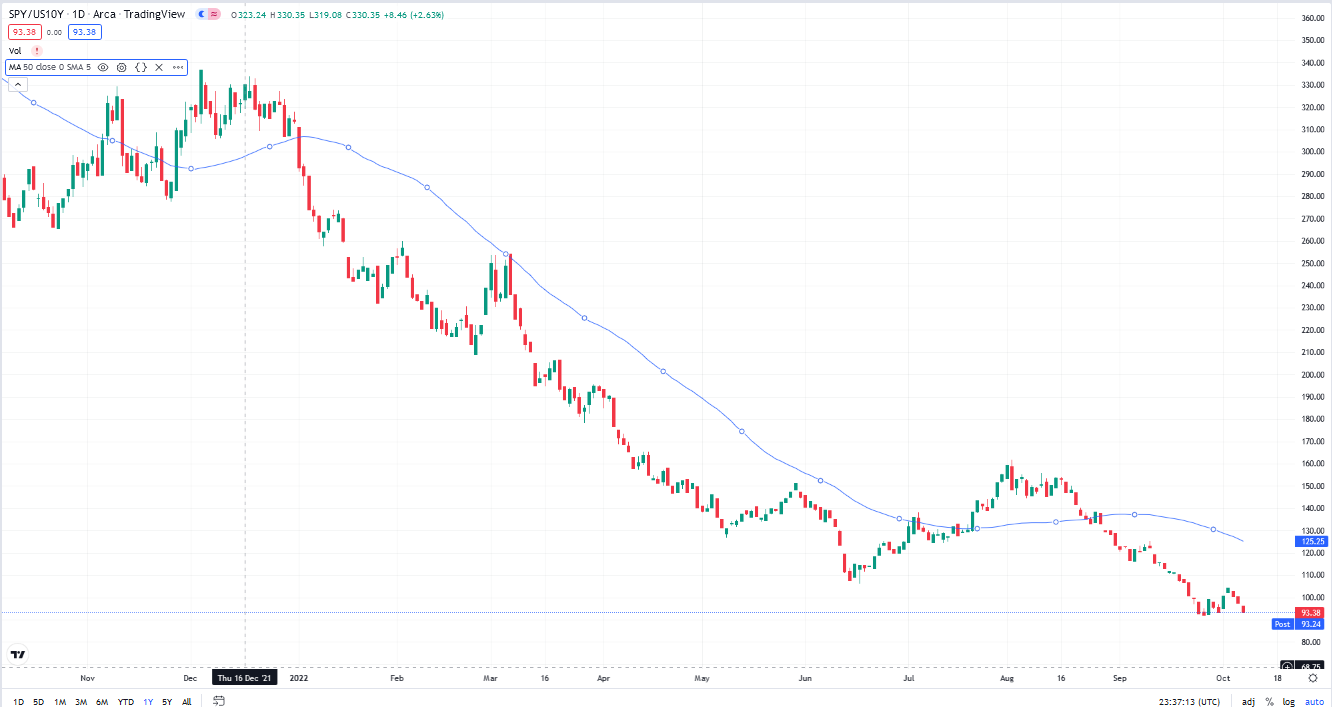
Sourced from tradingview.com
The indicator above is still not positive by trading above its 50-day MA. Since the two to ten-year treasuries are already at 4% unless something breaks in the domestic or international financial system, I think we are close to a bottom. Best to nibble at positions you like but wait for the signal deep value, dividend payers and commodity positions are the safest at this time.
We will work on a buy sell signal for the S&P 500 (long short) and for metal miners. In both cases we will use industry ETF’s for entering and exiting positions. We will provide a separate blog posting with the suggested ETF’s.
Written October 7, 2022, by Tom Linzmeier for Tom’s LOTM Blog at https://lotm.substack.com/
Accounts related to LOTM and Tom Linzmeier can & will, buy or sell securities at any time.
LOTM Research & Consulting Service
* An account related to LOTM holds a position in this security.
Neither LOTM nor Tom Linzmeier is a Registered Investment Advisor.
Consult your investment advisor for investment appropriate for you
To Unsubscribe please select “return” and type Unsubscribe in the subject line.
Tom’s LOTM Blog page https://lotm.substack.com/
![]()