
This week we shared an interview with Jeff Currie, director of Commodities at Goldman Sachs. He is certainly talking his book when saying the trend for the foreseeable future is owning commodities. We happen to agree with him regardless. His supporting evidence includes:
- A decade of under investment in mining and fossil based energy development.
- Environmental, social, Government (ESG) and media pressure to restrict development of mining and drilling (holding back supply).
- Government legislated demand for mined and drilled physical products.
- It takes years and sometimes decades to bring on new supplies of physical assets.
- This bottleneck of restricted supply and legislated demand, creates a bottle neck that will not soon be resolved.
The sell everything market correction that started in late 2021 and Q1 ’22 might be starting bifurcate. Copper is showing early signs of accumulation. This is not normal if we are heading into a recession. The price of copper is a leading indicator. The same signal is given from physical silver. Oil and gas have been strong but are correcting at the moment. We are bullish on this industry and believe the correction is part of a bigger upward trend still in place.
This morning I want to share some charts that illustrate the basing and hopefully new beginnings of upward trends in physical items (miners) needed for building the new energy economy. This has been labeled, “Revenge of the Old Economy.” This investment thesis, presented by Currie and Eastspring Investments, a Prudential division, suggests Value investing could very well out perform Growth investing for a four to eight years period going forward.
Chart action for physical copper:
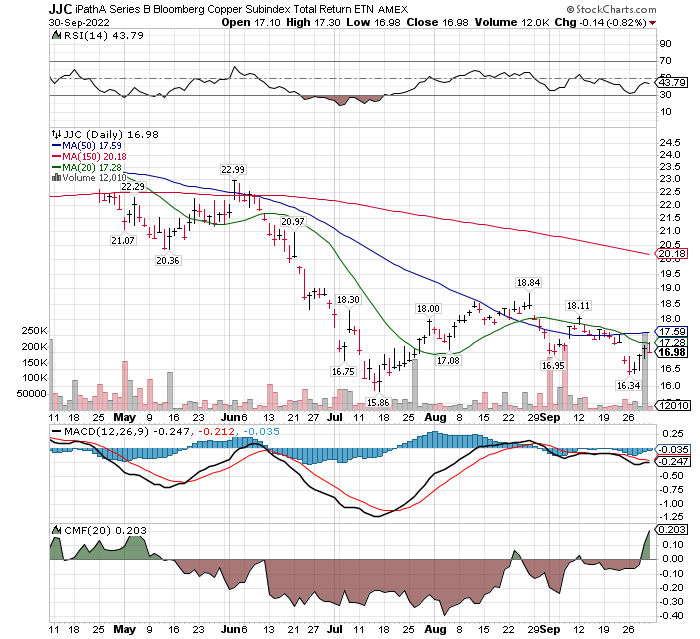
Copper: Early but worth monitoring. Basing chart pattern CMF, an indicator of accumulation or distribution suggests accumulation is happening.
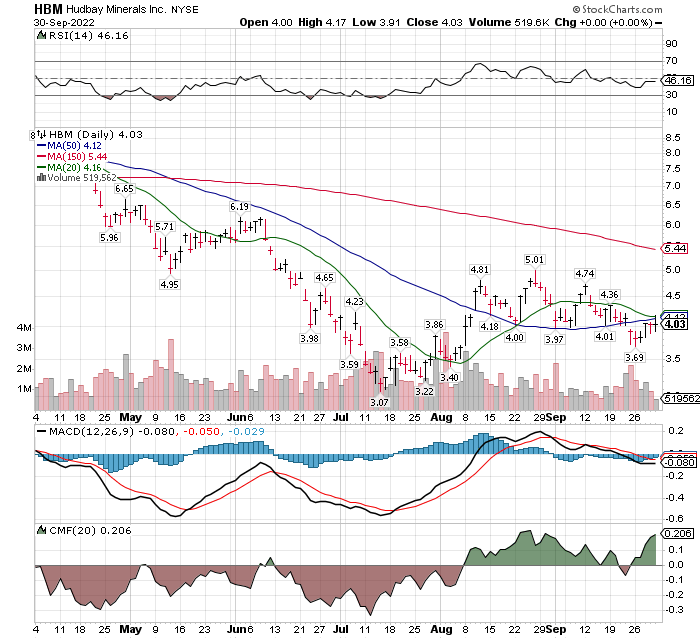
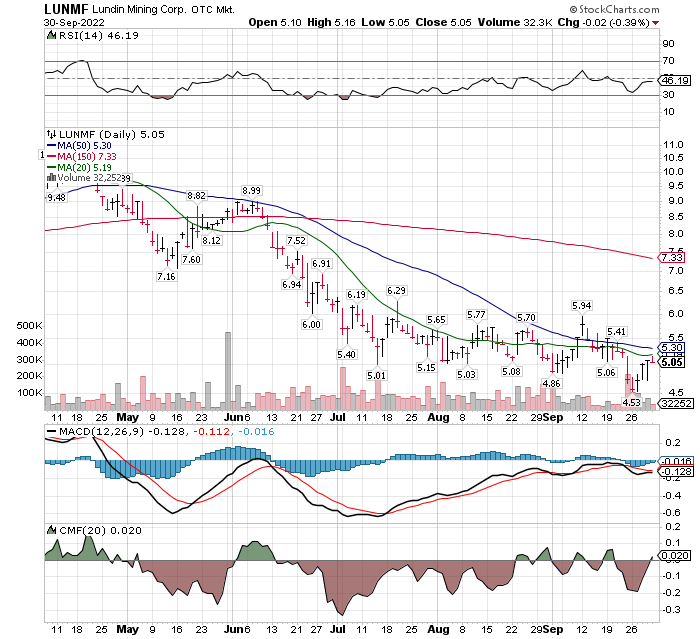
Copper miners LOTM likes.
Hudbay (HBM) $4.03 – Fwd P/E 5.11, dividend 0.5%
Lundin Mining (LUNMF) $5.30 – Trailing P/E of 5.4, dividend of 5.15%
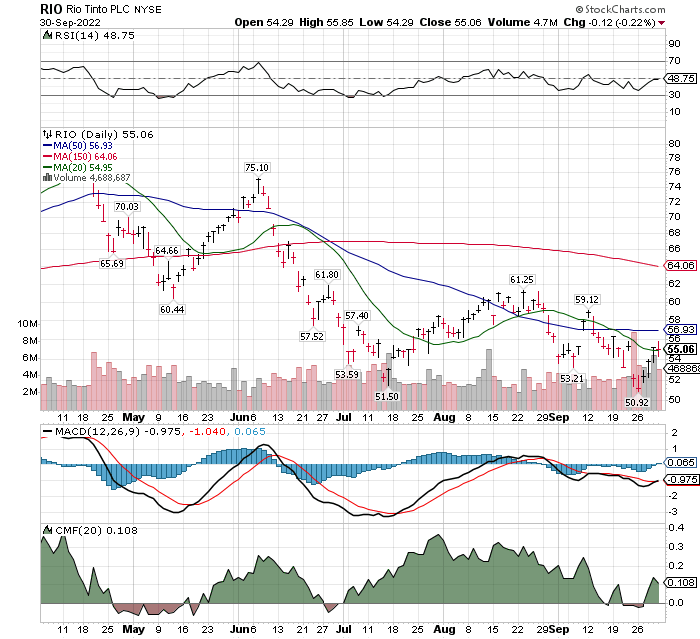
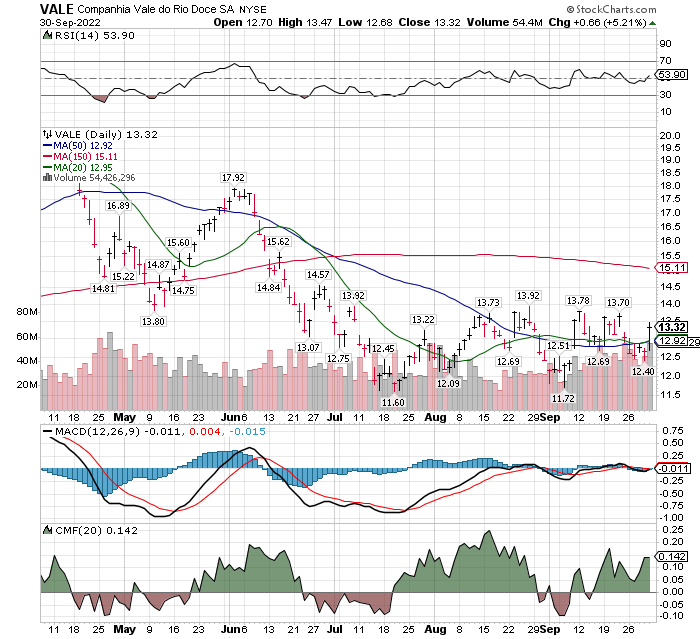
Multi-mineral miners – largely, iron ore
Vale (VALE) $13.32 – Trailing P/E: 3.11 – dividend 21%
Rio Tinto (RIO) $55. – Trailing P/E: 5.07 – dividend 12.4%
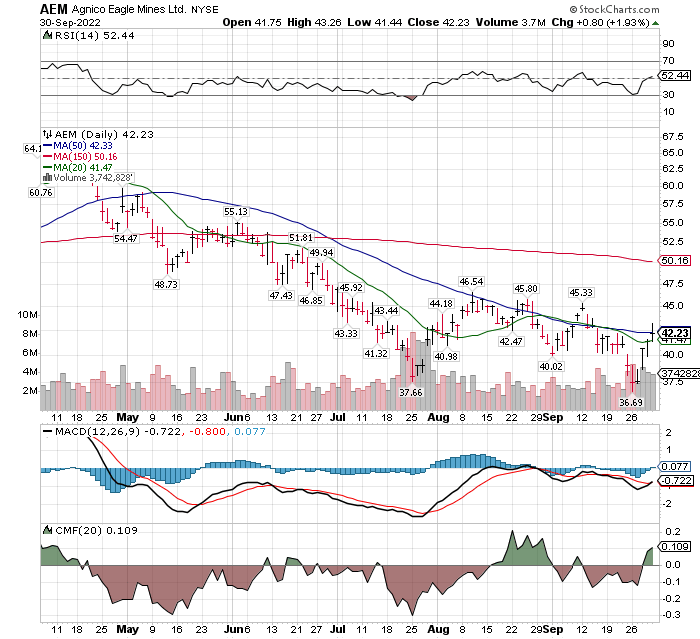
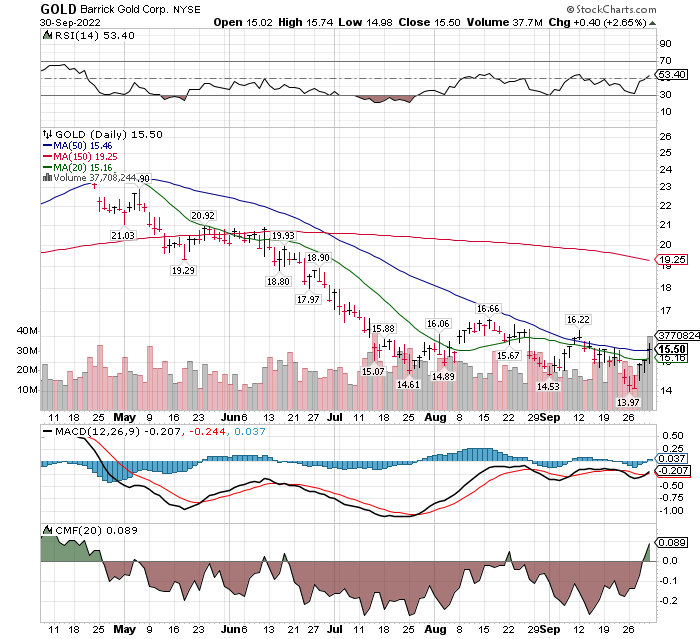
Multi-mineral Miners – primary mineral gold.
Agnico Eagle (AEM) $42.23 – Trailing P/E 23.79 – dividend 2.3%
Barrick Gold (GOLD) $15.50 – Trailing P/E 13.79, dividend 2.58%
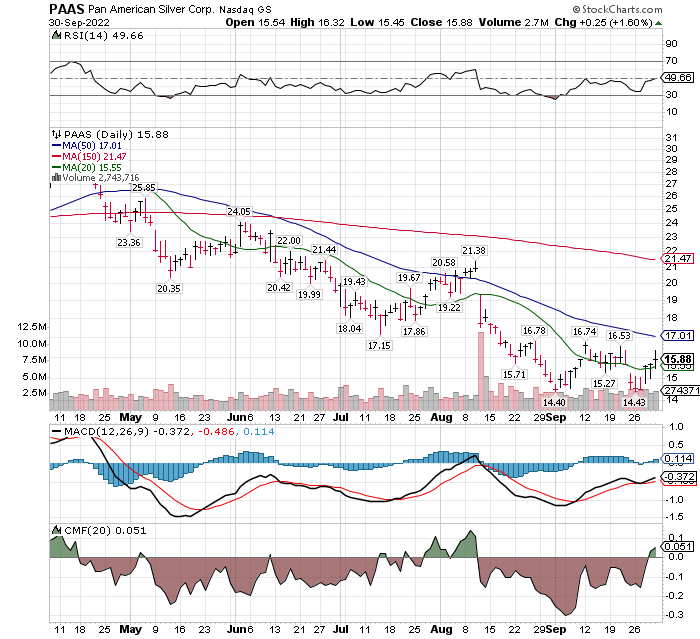
Multi-mineral Miners – primary mineral Silver.
Pan American (PAAS)* $15.88 Fwd P/E 22.21, dividend 2.52%
First Majestic (AG) $7.62 Fwd P/E 18.59, dividend 0.00%
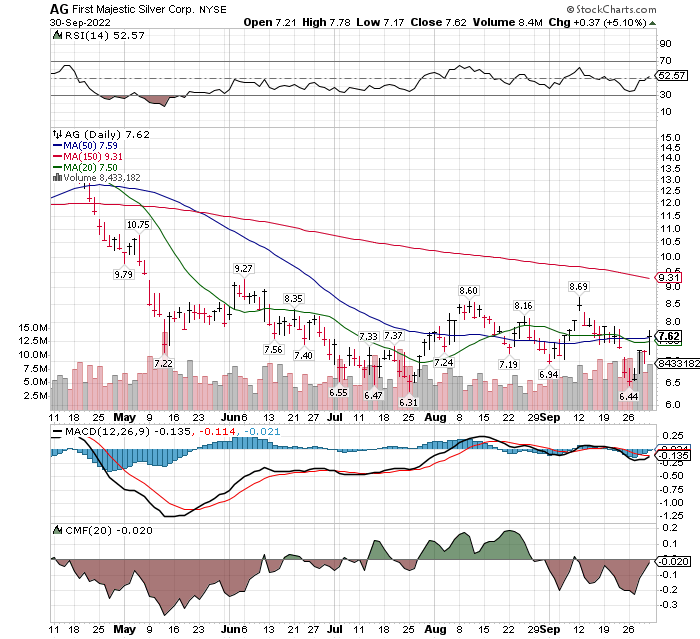
Great chart starting to break-out
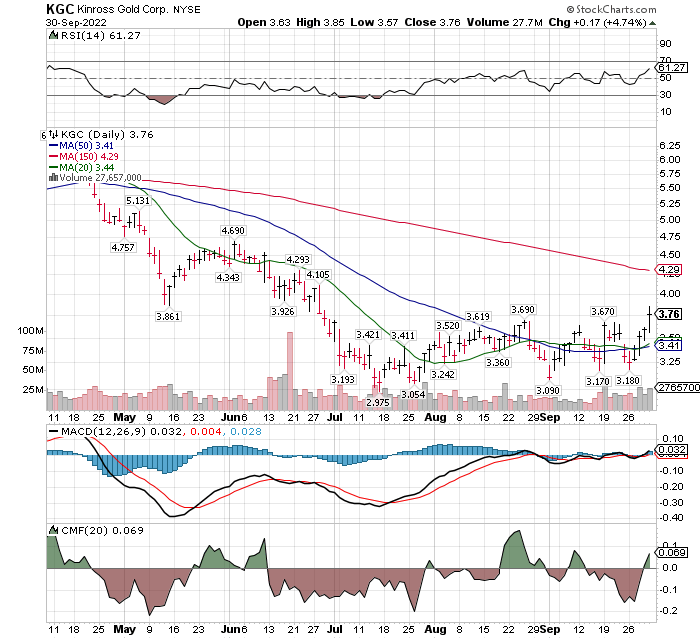
Kinross Gold Corp (KGC) $3.76 Fwd P/E 9.19, dividend 3.19%
In this presentation, we focused mostly on bigger mining companies in different mineral exploration. We wanted to share that accumulation is happening in the industry across all minerals and sized companies.
Our focus on bigger companies is to illustrate that institutional money is beginning to flow into the sector.
You know most of the usual suspects in the smaller companies. Smaller companies frequently offer better P/E metrics and growth rates than the bigger companies. Flow money to get excited about the smaller companies it helps to see the biggies move first. Next, mid-sized and then Nano-caps. The percentage gains are in reverse the nano-cap when they move give the biggest percentage moves. Think Roman Candle type explosive moves up and burning out quickly and then falling back to earth. The mid-caps and small cap move second but out performs the large caps. The big companies can give you doubles and triples and are general first movers.
- Three Junior Miners of High Value that can Double in Price SilverCrest, Victoria Gold, Skeena Resources
- Ten Producing Miners for Growth and/or Dividends. Technical View
- Ten Producing Miners for Growth and/or Dividends. Descriptive Comments
Basel III moved physical gold from tier three to tier one status. The official start date of Basel III is now Jan 1, 2023. Tire one status moved physical gold to be the equivalent of cash for the international banking system. We believe there was a reason this was done in this current time of uncertainty for fait currencies. If gold were to increase in value significantly over the next two to five years, it would shore up the asset value for commercial banks at a time when their debt levels are at historic high levels. Think about that for a while. The current debt problem for central bank debt is at historically high levels. This level of debt have never been repaid. If gold can be elevated to a high enough level, debt and assets balances can come closer together and save the financial system. This is a marathon for the global banking system, not a sprint. We believe everyone will benefit by having a 10% or higher exposure to physical gold silver and other metals and/or the miners of these metals.
End of quarter phenonium.
We could have seen some end of quarter buying for window dressing purposes. A sell-off in the miners in the first weeks of Q4 can be seen as an opportunity to buy. Seasonality now favors the miners. Q4 and early Q1 is generally their best seasonality price performance period.
- Written October 1, 2022, by Tom Linzmeier for Tom’s blog at www.LivingOffTheMarket.com
- Never forget – God spelled backwards is DOG, our best friends. 😊
Accounts related to LOTM and Tom Linzmeier can & will, buy or sell securities at any time.
LOTM Research & Consulting Service
* An account related to LOTM holds a position in this security.
Neither LOTM nor Tom Linzmeier is a Registered Investment Advisor.
Please refer to our web site for full disclosure at www.LivingOffTheMarket.com ZTA Capital Group, Inc.
To Unsubscribe please select “return” and type Unsubscribe in the subject line.
.
![]()