
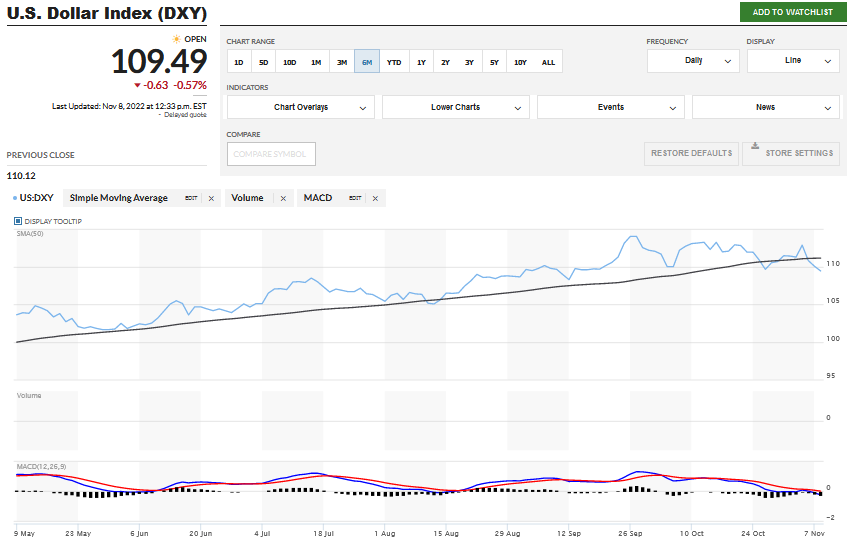
The US Dollar is breaking below its 50-day moving average (black line with blue being the US Dollar). This is creating a negative (selling) signal for the target period of two to four-month time line for computer algorithms.
US Dollar divided by physical Silver below.
When the US Dollar is price in silver (below) we can see that US Dollar is falling rapidly against the price of silver.
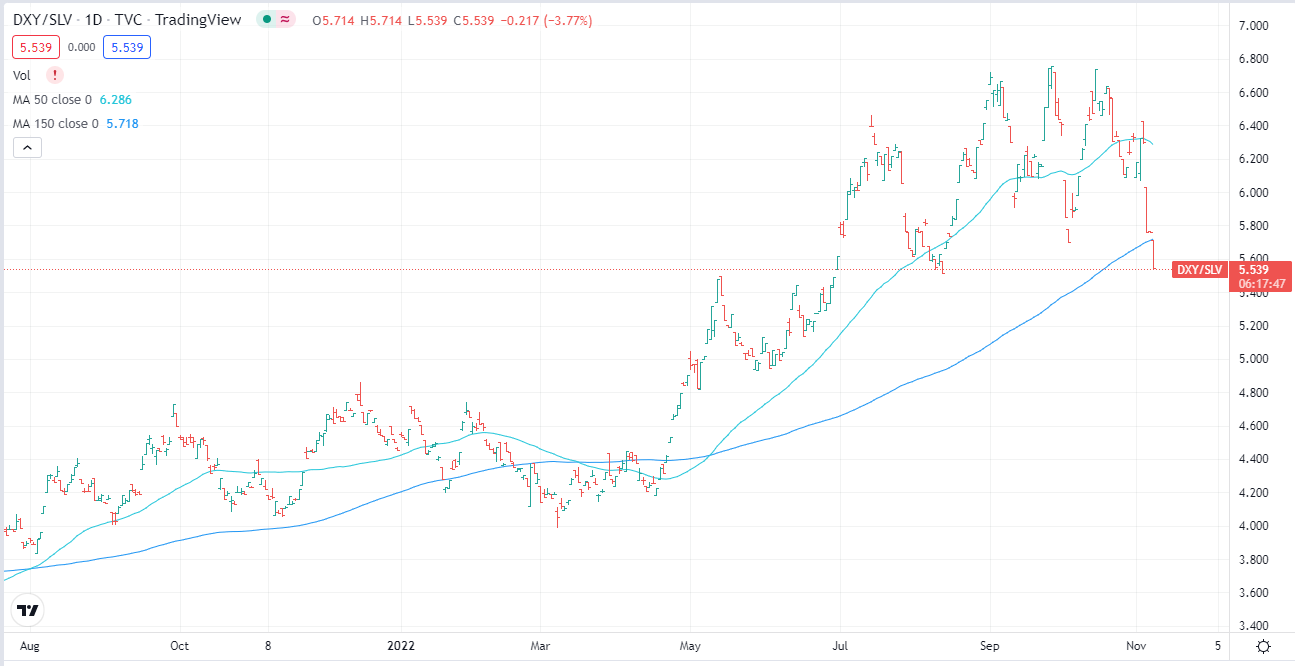
Silver miners are reacting dramatically stronger against the falling US Dollar.
Below are quick chart visuals for a few of the miners LOTM likes. Look for sharp but short corrections in silver and gold miner prices if wanting to buy or add to positions.
The remaining blog is reserved for paying members of Tom’s LOTM Blog.
Consider subscribing to receive your subscription ending December 31, 2023,
That’s more 13 months for $239 one-time fee. That breaks down to a monthly rate of $17.45
Thank you for considering.
Sign up through
2) send a check payable to Access Vietnam Group.
Mailing address: Tom Linzmeier, 339 Summit Ave #4, Saint Paul, MN 55102.
3) Direct deposit by ZellePay.com to US Bank, Access Vietnam Group, phone 651 245 6609.
Hope to see you on the other side!
Tom
![]()