
- VanEck Vietnam ETF (VNM) $15.03
- StoneCo (STNE)* $9.42.
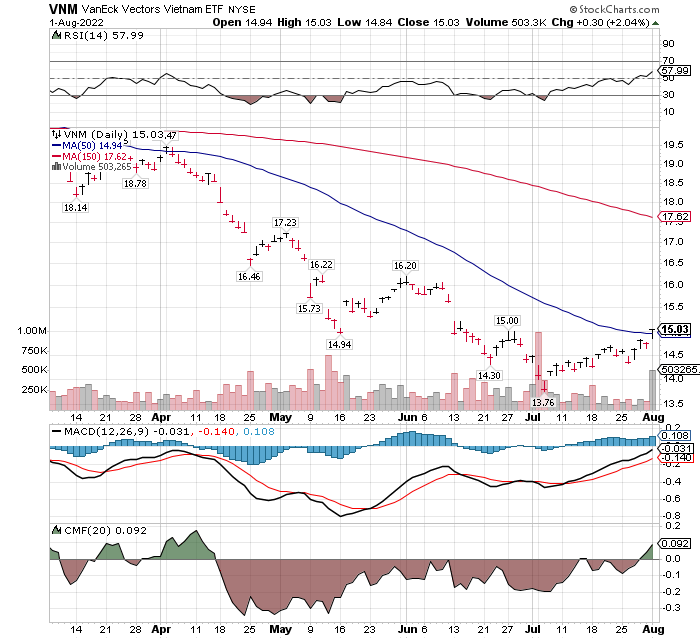
LOTM is tracking a number of Country ETFs watching for a shift of money into Emerging Markets. In the countries we are looking at, the “countries” are in better health than the United States is in. Please refer back to comments we made on Vietnam, and additional Country ETFs linked here. We are certainly early on our call as VNM only crossed its 50-day moving average on Monday Aug 1st. There is time to monitor and watch for further developments. Vietnam shares can move quickly if foreign money flows into their market.
There are other signals we look at for a possible buy signal. We use a “sum of the evidence” to increase the probabilities of success. Some of the signals are listed below:
- VNM’s RSI is above 50% of market stocks.
- MACD has been on a cross-over buy signal since about July 11th.
- CMF is above the zero line showing accumulation of shares of VNM.
- Now we have the price cross-over above the 50-day moving average.
Traders can use a stop loss 1/3rd your trading goal and follow a rising price up with a trailing stop.
Investors use either a trailing stop or dollar-cost-average into VNM on weakness with a 10% stop on your average cost of the multiple purchases.
Vietnam is traded much like Gold or another commodity. Most Foreign Institutional Traders buy Vietnam simply for Technical reasons.
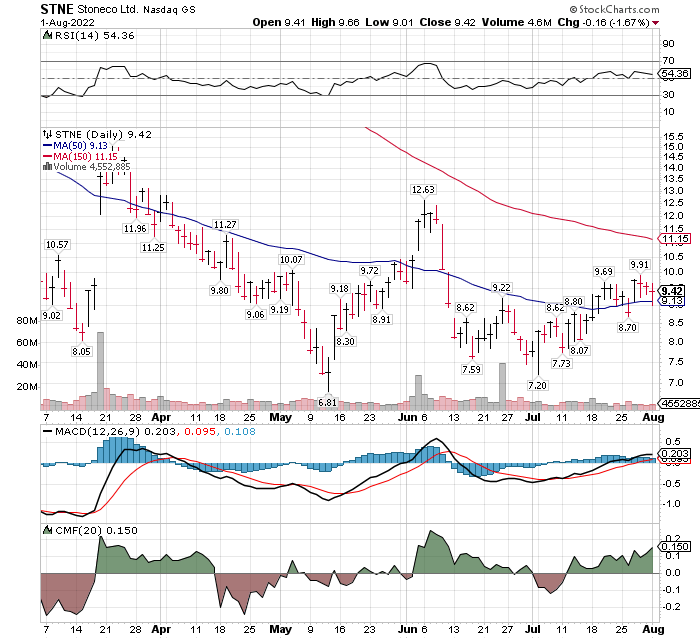
Please refer to our comments on Brazil in the same post linked for Vietnam. StoneCo, a Brazilian FinTech company, is performing exceptionally well with 100% growth in revenue quarter over year prior quarter.
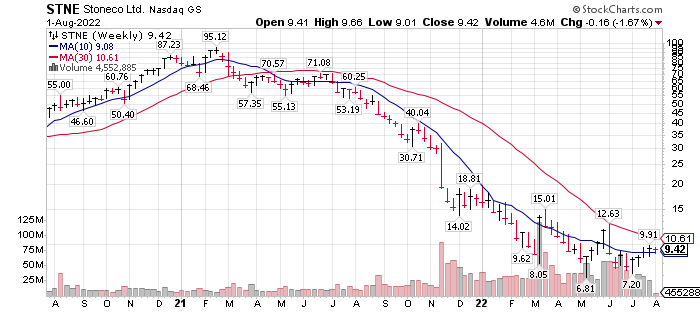
A quick look at the two year-chart below shows us where StoneCo has come from you the “company” and survived a negative company mis-step and is now storming back with growth and profits. Chart below:
StoneCo is trading at projected forward price earnings (P/E) of 2.89 and earnings projected at $3.26 per share.
It is fair to say, Analysts believe StoneCo is growing nicely and faster than inflation, both official and unofficial.
- STNE’s RSI is above 50% of market stocks.
- MACD is on a crossover buy signal.
- CMF is above the zero line showing accumulation of shares of StoneCo.
- The 50-day moving average now under the stock price.
- In addition, StoneCo has an double bottom chart formation.
Make no mistake StoneCo is still in a bottoming chart formation – Stage 1 chart formation. We bring StoneCo to your attention because StoneCo’s stock has doubled in price in one week’s time. The price can be an explosive position. We happen to believe the company downside risk is low and the upside potential greater by a long distance.
Good Fortune to all. Our comments here are based on technical signals even though we refer to fundamental items.
Written Aug 1, 2022, by Tom Linzmeier, editor, Livingoffthemarket.com Blog/Newsletter.
LOTM Research & Consulting Service
* An account related to LOTM holds a position in this security.
Neither LOTM nor Tom Linzmeier is a Registered Investment Advisor.
Please refer to our web site for full disclosure at www.LivingOffTheMarket.com ZTA Capital Group, Inc.
To Unsubscribe please select “return” and type Unsubscribe in the subject line.
![]()