
Tradition has the S&P 500 priced in US Dollars. If however, the purchasing power of the US Dollar is declining due to money printing and the resulting inflation the S&P will rally. That does not imply that you have maintained your purchasing powers. Somethings are not included in the inflation rate. Things like home prices and food.
To give a better picture of our purchasing power we have used gold and Bitcoin as the denominator to the S&P 500. Because gold has historically not been devalued through excess money printing, we can use gold to be a better savings vehicle than the US Dollar.
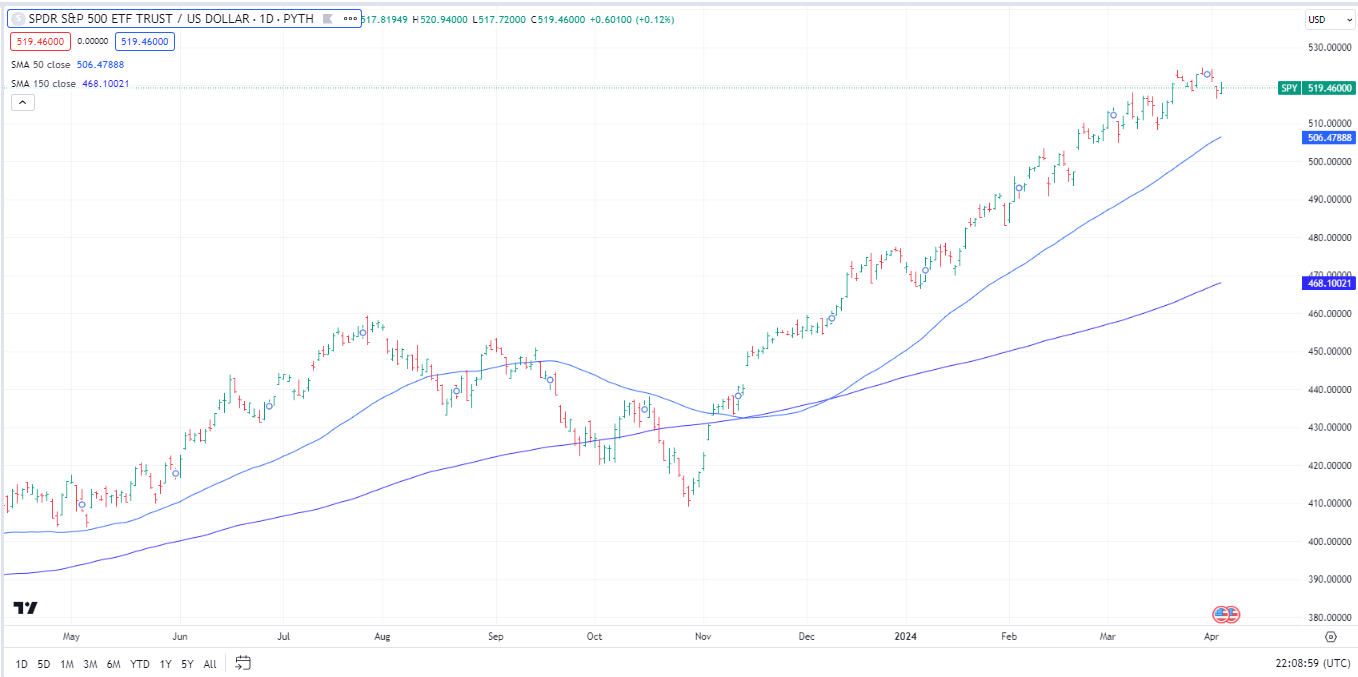
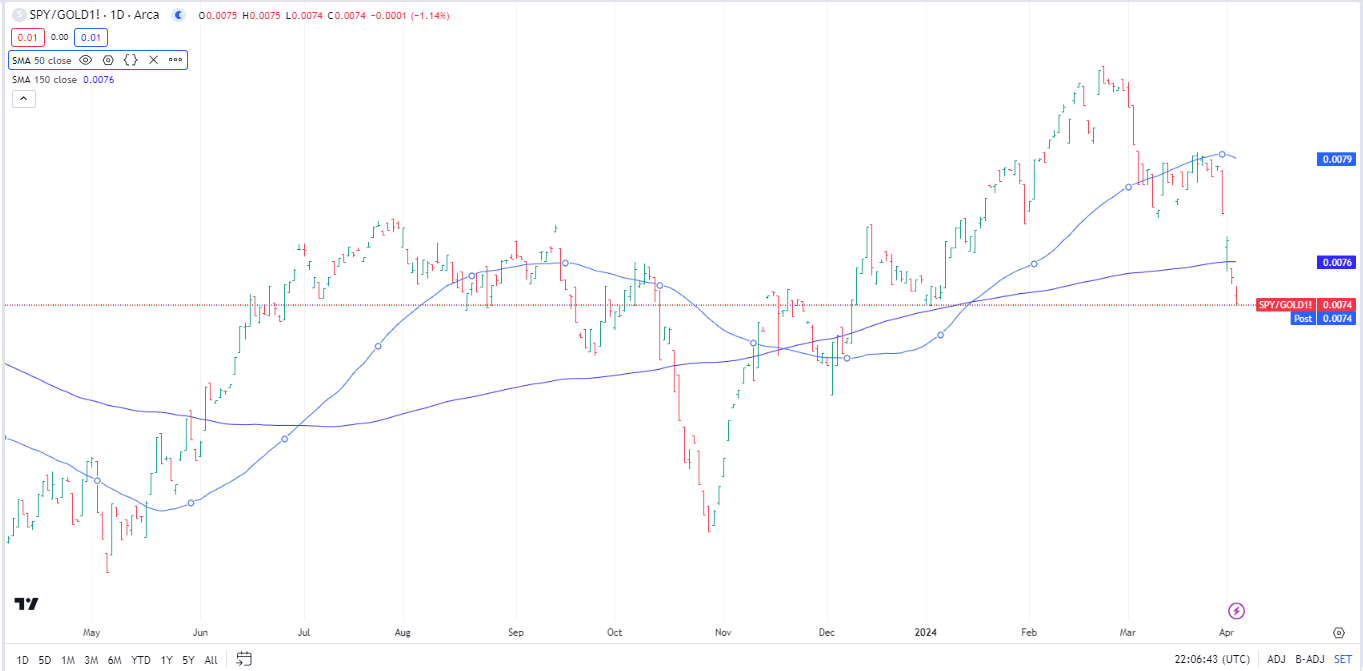
Here what the last year look like for S&P 500 performance when priced in US Dollars. Below that graphic we show that the S&P 500 performance is when priced in gold.
We are NOT saying avoid the S&P 500 and always own gold. What we are sharing, is the hard fact that there are times to own the S&P 500 and there are time to own gold. We are in a period where gold is trending higher and out-performing the S&P 500.
The solid line in the charts are the 50-day and 150-day moving average of the SPY/Gold ratio.
The time for the shift to gold out of the S&P 500 was in the last week of February if looking for the high water point of the S&P 500 Vs gold. If using the S&P 500 ratio to gold the sell would have been when the ratio cross-over happened in early March. You can see by the symmetry in the price action and the failure of post cross over rally to regain a positive cross-over, that computers are programed to react to the SPY/Physical Gold ratio cross-over to “make the trade.” This has negative implications for the SPY if price in gold for this trade. SPY priced in US Dollars might react differently, depending on the trend of both the SPY and the trend of the US Dollar. This would be consider a shift to the asset class – from growth equities to hard assets.
SPY/Gold crossing below the 50-day moving average ratio, has resulted in an excellent rally for about four to five weeks for gold and silver and their respective miners.
As a technical opinion of the lower chart, we suggest the market is ready for a pause or correction (negative for gold / positive for the S&P 500) but the trend is clearly towards hard assets and from equities. Does not mean equities have to fall a lot. It just says Gold and silver a hot Vs equities. We would suggest looking for a short sharp, pull back in gold and gold stocks to buy or add to gold and gold miners (silver as well).
It is our humble opinion that the shift to hard assets will last for another six to nine months. Longer than that, we can’t say at this time. It is just an opinion for you to consider.
Accounts related to LOTM and Tom Linzmeier can & will, buy or sell securities at any time.
LOTM Research & Consulting Service
* An account related to LOTM holds a position in this security.
Neither LOTM nor Tom Linzmeier is a Registered Investment Advisor.
Consult your investment advisor for investment advice appropriate for your situation.
To Unsubscribe, please select “return” and type Unsubscribe in the subject line.
![]()