
My current view of the market is that the decline from the market high in 2021, is a result of rapidly rising interest rates. It is not likely that the market correction is over yet. There is likely a second wave of selling that awaits us in 2023. The 2023 wave will involve a drop on earnings per share, corporate layoffs and bankruptcies. Remember the saying, “A recession is when your neighbor is laid-off and a depression is when you are laid-off.” That is coming next year. Some of us will be choosing between electricity, heat or food. This hardship is caused by government policies that are crushing the economy while at the same time causing energy policy induced inflation. It does matter for whom you vote. That is not to say I am a fan of either party. They are both controlled by lobbyists of various corporations and a deep state group no one elected.
Inflation is here for a long time. Higher costs will come from
- Reshoring industry back to the USA where labor, material costs and interest rates are higher than the last 20 years.
- From an energy policy that has no critical thinking applied to its implementation.
- Funding a war that did not need to happen and potentially initiating a second conflict in SE Asia.
- Weaponizing the US Dollar to retain the USD$ reserve currency status.
- Running a Modern Monetary Theory policy that says the level of debt and spending does not matter.
Passive investing is becoming recognized as a strategy of the past ten to fifteen years. Being in the right place at the right time (Active Investing) is the old/new game again.
Positioning in front of commodity bottle necks, shifting macro trends and inflation investing instead of deflation investing strategies is important. Recognize that War time investing Vs Peace time investing is the new norm.
Active Investing:
LOTM has shared some simple guidelines for Technical trading in prior emails. In investing or trading, you have to decide what time horizon fits your life style and personality. Short, intermediate or long-term time horizons. That is your biggest challenge. Understanding your own personality and matching it to a plan.
An advantage you can bring to your investment/trading plan is to work with the same trading/investment vehicle over a long period. Overtime, in working the same vehicle you will become entrained subconsciously with the rhythm of your chosen vehicle. Could be a company or an industry. We have chosen some ETFs that we think will be positive reacting in 2023 to help you along this path.
Fundamental Knowledge: In choosing an industry or country ETF, you can follow news specific to that industry or country. If you do this, you will soon you will know more than 95% of the population about that chosen area. Picking an area you have an interest, a passion or work related knowledge, speeds up your process.
Technical Knowledge: A ten minute check of the price in a limited number of ETF’s daily or weekly (a time factor for you to decide) will put you in an entrained rhythm with the price. It is a form of meditation. Do not underestimate this exercise. In time you will grow to “know” without thinking, what to do. Do your thinking outside of market hours and your “knowingness” during market hours. Don’t overtrade, however. Select your five key technical indicators for buying or selling. This creates the “probability of success.” We are never going to be perfect, but we can strive to be perfect. This is a probability game. Everything here mentioned here, is to set the stage for the probability of success.
Risk Management: If choosing to trade Vs position building, use a stoploss of cost policy. A disciplined use of stop losses is no reflection on you or your self-worth. It is part of the process. No single stop loss is meaningful. Work on probabilities. More winning trades than losing trades. High percentage gains then the percent of trade losses. To do this, keep a daily trading log. Summarize it weekly or monthly to “know” your pattern and habit. The goal is to expand both your win vs loss number and gains above loss percent.
Money management. A trading discipline guideline is no more than three trades on at one time. More than that and you lose focus and concentration. No more than 10% of your trading money at risk at any one time. Three position on at once – 3.35% in each position. One position on at a time and you can go to 10% of capital – but 5% is better. This is a business. Don’t blow up your business in one or two trades.
Tight stop losses/Disciplined stop losses. You are more concerned about preserving capital – not being right or wrong. Right or wrong first thinking is your ego talking. Crush your ego and be humble. Three to one benefit to risk ratio. If your max risk is 5%, target your minimum gain goal on that trade at 15%. If your minimum gain goal on a longer-term trade is 50%, then 15% is your stop loss. It is the ratio that is key. Consistency builds probabilities. Emotions, hunches and feelings, crush probabilities. This is a probability game.
When the market is “trending upwards,” it is easy to get sloppy and think you are better than you are. This market is now a bear market that will give you plenty of opportunities, but you need to be disciplined, alert and use probabilities to succeed.
Guidelines at this time:
- Seasonality suggest an upward bias between now and January – possible a bit into January.
- War Time investing and inflation suggests probabilities that energy and commodity related sectors are better investment areas than growth stocks.
- Dividend payors are better than non-dividend paying stocks.
- Stock’s whose underlying companies are positive cash flowing and earnings positive are better than negative cash flowing and negative earnings companies. Liquidity is tight not expansive.
ETF’s who might have bottleneck benefits or positive inflation influences:
Let us know if you want the PDF version with interactive links that work!
Money @ LivingOffTheMarket.com
The links in this graphic likely do not work. Email us if you want a PDF that you can used daily or weekly with quick links to entrain yourself to the rhythm of the price. Close the gaps on the email above to make the request.
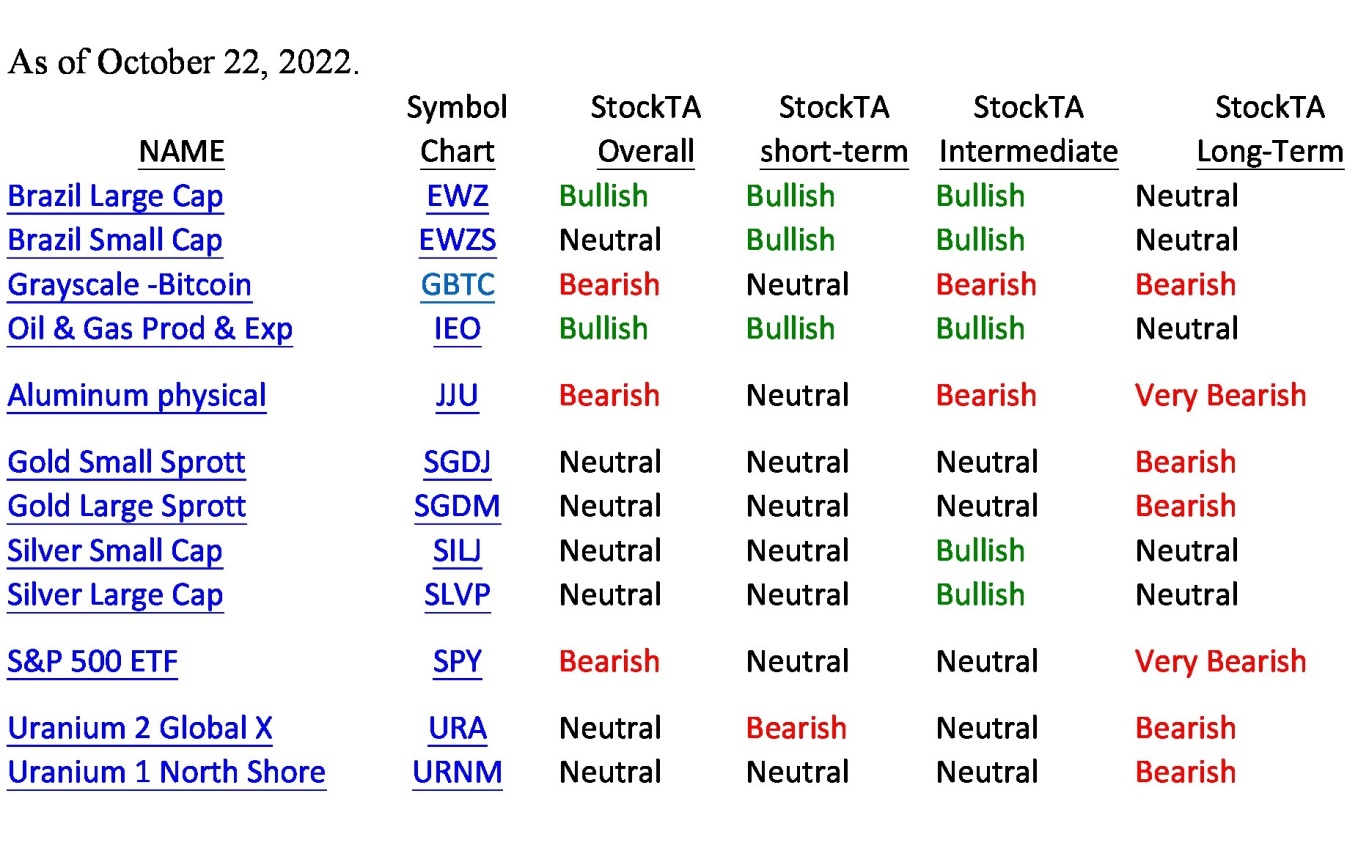
The more you understand yourself, what you want and the flow of Bullish, Bearish & Neutral from the various time periods above, the greater you will come to develop a system unique to you. Use the above with a chart service like StockCharts.com. We will go through our check list of indicators to give you a “probability” of success factor. Since we are all different you might have or develop different indicators the fit your personality.
Brazil Large Cap ETF (EWZ)
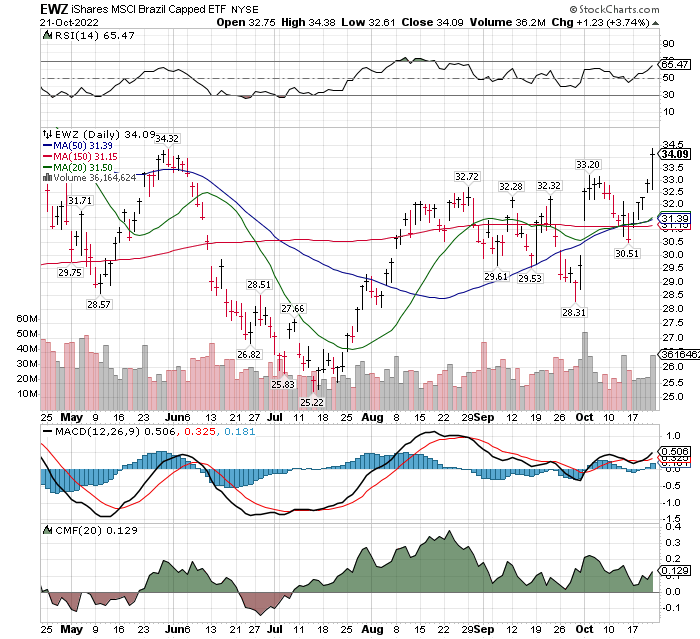
#1) Relative Strength (RSI) above the 50% line and rising. Tells us the position is performing better than 50% of the market.
#2) Stock price is above one or more of our key moving averages. We use the 20-day, the 50-day and the 150-day moving averages (MA) as cross-over points.
#3) Shorter term moving averages rising (buy) above longer-term moving averages or fall (sell) below longer-term moving averages. 20-day being above the 50-day and 150-day is bullish.
#4) Moving Average Convergence Divergence (MACD) black line (shorter-term) is above the red line (longer-term. The histogram (blue indicator) is simply another way to see the same thing. This is a widely used trading signal and frequently leads the price crossing moving average signal.
#5 CMF (Chaikin Money Flow) is a measure of larger trades Vs smaller trades over time. The green signals the larger trades are on the buying trades, signals accumulation while the red shows the larger sized trades are selling, showing distribution.
When we get all or a majority of these technical indicators aligned, the probabilities of a successful trade increase. Nothing is perfect so when it does not work, it is not an big deal. Adapt, adjust and wait for the next signal.
The other buy signal in the short-term column from StockTA graphic above, is the Oil ETF – IEO.
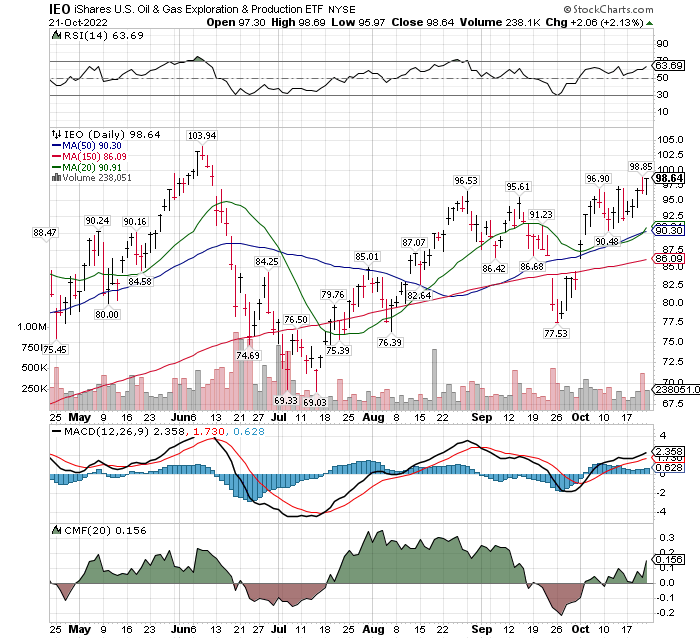
We will not go through the five technical signals. You know what to check on your check list. The rally off the September 26 low is quite powerful.
Learn to use options to assist your trading plan. Consider Oil as energy. Nothing happens in the world or our life without energy. Energy is so important, and governments know this. Entrain yourself with the relationship between the three indicator RSI, MACD and CMF and the price with moving average movements.
For fundamental information on oil and energy, we recommend getting on the OilPrice.com website and its article mailing list. News here is often ahead of the oil price movements.
Consider subscribing to LOTM Daily Ideas and not missing any issues of our Blog!
We will go behind a pay wall, November 1, 2022.
The cost is a one-time payment of $239 for 14 months, ending Dec 31, 2023. That is a Monthly rate of $17.07.
Sign up through 1) Substack or 2) send a check payable to Access Vietnam Group. Mailing address: Tom Linzmeier, 339 Summit Ave #4, Saint Paul, MN 55102. 3) Direct deposit by Zelle to US Bank, Access Vietnam Group, phone 651 245 6609.
Written October 22, 2022, by Tom Linzmeier, for Tom’s Blog at https://lotm.substack.com/.
Accounts related to LOTM and Tom Linzmeier can & will, buy or sell securities at any time.
LOTM Research & Consulting Service
* An account related to LOTM holds a position in this security.
Neither LOTM nor Tom Linzmeier is a Registered Investment Advisor.
Consult your investment advisor for investment advice appropriate for your situation.
To Unsubscribe, please select “return” and type Unsubscribe in the subject line.
Tom’s LOTM Blog page https://lotm.substack.com/
![]()
Pingback: LOTM: Nine Actionable Ideas for a Declining US Dollar -