
Dr. Copper is acting like she wants to rally…… maybe it will rally or maybe not, but it is a good signal that copper did not go to a new low from its July bottom.
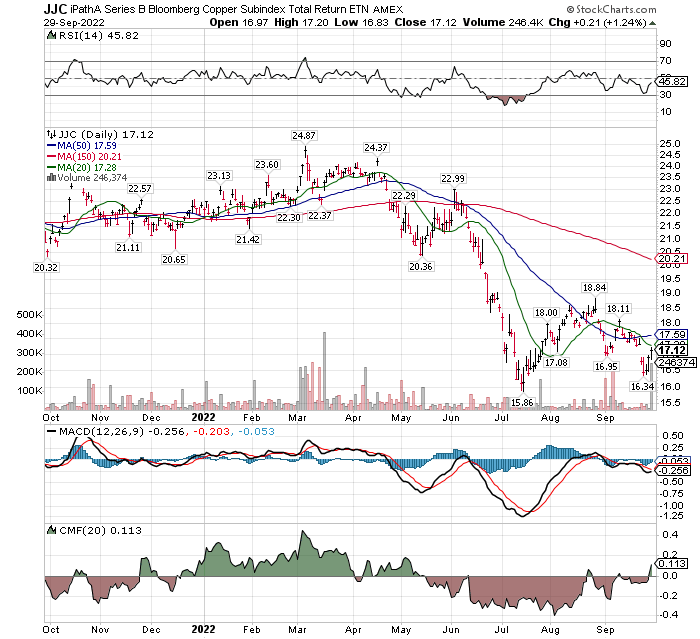
- None of the indicators went to new lows or as deeply over-sold vs July. A good signal for the Market.
- Volume precedes price. Volume is coming into the shares today with the price higher on the day. JJC is an ETN that is directly related to the copper futures market.
- Copper’s indicators have not turned positive but are mixed and turning positive. We easily could see a majority of technical indicators turn completely positive next week.
- Dr. Copper is a leading business/economic/market indicator.
About JJC:
JJC tracks an index consisting of a single copper futures contract at a time. The methodology weights the contracts by liquidity (2/3) and US dollar-weighted production (1/3). Contracts follow a fixed schedule, the index rolls into contracts two months from maturity in February, April, and June, and three months from maturity in August and November. The index continues tracking each contract until shortly before expiration. As an ETN, JJC does not issue a K-1 at tax time, but investors must accept the counterparty risk from the issuer, Barclays. Treat this as a leveraged trade on physical copper.
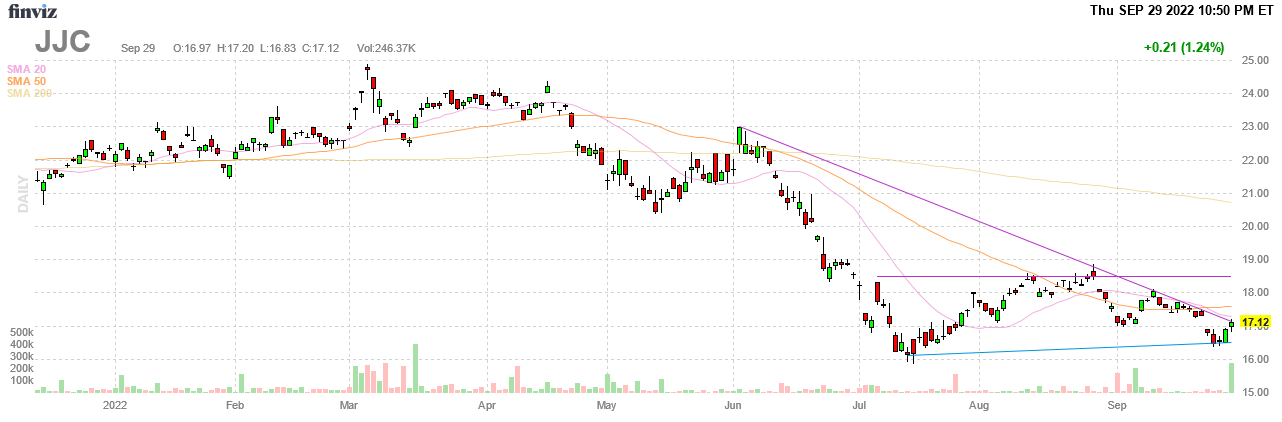
Slightly different view of the JJC chart from Finviz:
https://finviz.com/published_idea.ashx?t=JJC&f=092922&i=JJCd225083504i
- A close above $18 and then $19 would be progressive price improvements that could signal a trend reversal for Copper. A move above $18 would be a move above the 20-day and 50-day moving averages. A move above $19 would signal a break-out move above the high price resistance level of this basing pattern.
- Note the positive and large volume increase today.
The overwhelming question has been, is the next 10% move in equities up from a June/September double bottom, or down and a break-down lower?
There are excellent technicians and fundamentalists on each side. So basically, everyone is guessing.
Behavioral signals, the third indicator, would suggest sentiment is now worse than at the lows of 2008 market sell off – a bullish signal.
Written September 29, 2022, by Tom Linzmeier for Tom’s Blog at www.LivingOffTheMarket.com
Accounts related to LOTM and Tom Linzmeier can & will, buy or sell securities at any time.
LOTM Research & Consulting Service
* An account related to LOTM holds a position in this security.
Neither LOTM nor Tom Linzmeier is a Registered Investment Advisor.
Please refer to our web site for full disclosure at www.LivingOffTheMarket.com ZTA Capital Group, Inc.
To Unsubscribe please select “return” and type Unsubscribe in the subject line.
![]()