
- What is the Cumulative Advance/Decline Line saying?
- New HIGH/LOW Ratio says yes, The Bear is in the Past.
- Potential opportunity in the coming months: Two ideas, one conservative and one speculative.
What is the Cumulative Advance/Decline Line saying?
Declaring the Bear is dead is a dangerous thing to do. Let’s define what we are looking at and you decide for yourself if it makes sense to you.
If the majority of stocks are falling in price, we can logically say we are in a bear market. If we accept that, we can then say if the majority of stocks are rising in price, then we are not in a bear market. Price above moving averages and shorter moving averages, above longer moving averages, are measures used in Trend analysis.
To check this feature, let’s look at the weekly advance/decline line for the NYSE at StockCharts.com
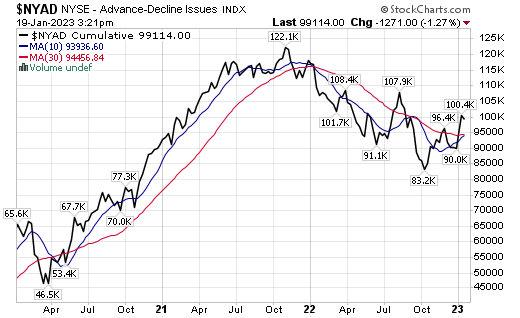
Rising from the October Lows we see that yes, in fact the Advance/Decline Line (AD Line) is rising and above both its 50-day (10-week in the chart) and above its 150-day MA (30-week in the chart). The 10-week is very close to crossing above the 30-week MA. This would be a second confirming indication that the market is in a rising trend. In looking at the chart and thinking of the market as a bouncing ball, it does appear that we are about to test the lows one more time to see how solid the “market bottom” is. Perhaps that is the mode we are in now. Still in a stage one bottoming process but looking like we are close to breaking out. This is based on the weekly AD Line. We could be in the latter half of forming a reverse head and shoulders pattern.
Conclusion: The cumulative AD-Line trend is turning positive. We are close to calling an end of the Bear but need one more test of the Lows on the AD-Line or we need a break-out above the summer high AD-Line marker – on the chart with the 107.9K number. The sell-off this week could be the test. We will know more next week.
New HIGH/LOW Ratio says yes, The Bear is in the Past.
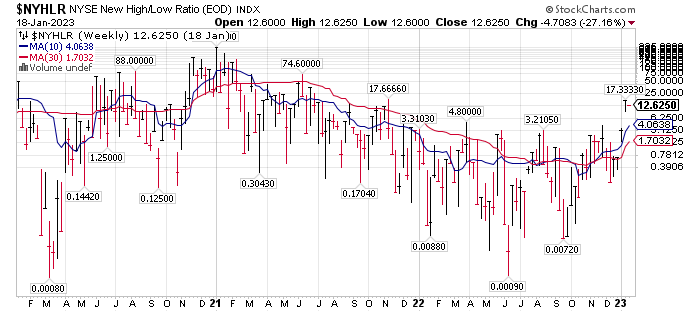
Based on the NYSE New High / New Low Ratio, we appear to have a nice reverse head and shoulders patter formed. The Left shoulder is in February 2022. The head was reached in June of 2022. The right shoulder was formed in September of 2022. The 10-week MA is rising and above the 50-week-MA, which is also rising. The weekly Hew High/New Low is above both the 50-week and the 10-week MA. It looks like a rising trend to me.
Certainly, there will be bumps along the way and one has to be in the right sector of the market, but the New High / New Low ratio suggests buy the dips in the market. We used the three year weekly time line to get the perspective of the major trend.
Here is a quick peak at the daily, one year AD-Line:
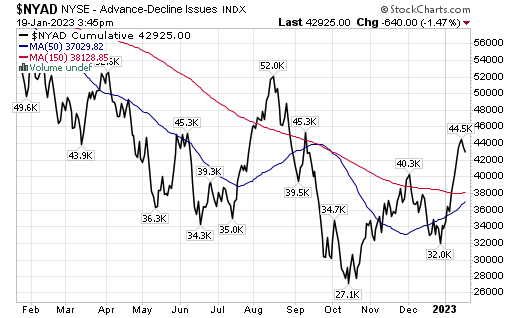
We have the same conclusion in the Daily AD-Line as with the Weekly AD-Line. Looks like a test of the 150-day moving average is happening in the coming weeks. The 50-day is rising and is suggesting it might break above the 150-day moving average. A potential golden crossover.
The Daily New High / New Low Ratio:
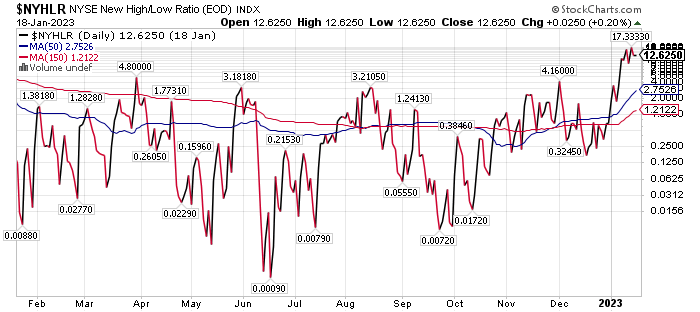
The one year-daily confirms what we saw in the three-year weekly chart. A rising trend with 50-day above a rising 150-day moving average.
Conclusion:
We would buy the dips anticipating the Bear market is completed, but also anticipating the market will likely be a trading market for six to nine months. Stage one consolidation. As a “reason” for the longer choppy market, is to follow Fed Chair J. Powell comment that interest rates will remain high for a longer time than most anticipate.
Potential opportunity in the coming months:
- Two ideas. One is more conservative, and one is more speculative.
The remainder of the blog is reserved for behind the paywall subscribers. We hope what was shared today is helpful in your decision making process.
For More Actionable stock ideas, consider a subscription to Tom’s LOTM Blog.
Written January 20, 2023, by Tom Linzmeier, for Tom’s LOTM Blog at https://lotm.substack.com/.
Accounts related to LOTM and Tom Linzmeier can & will, buy or sell securities at any time.
LOTM Research & Consulting Service
* An account related to LOTM holds a position in this security.
Neither LOTM nor Tom Linzmeier is a Registered Investment Advisor.
Consult your investment advisor for investment advice appropriate for your situation.
To Unsubscribe, please select “return” and type Unsubscribe in the subject line.
Tom’s LOTM Blog page https://lotm.substack.com/
![]()