
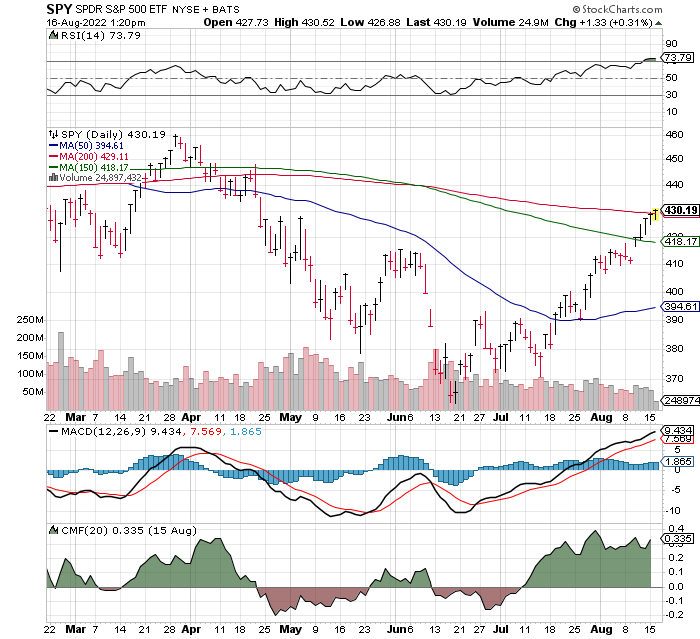
Systems are showing positive technicals factors but no longer under-valued. Not we are in the top of the momentum readings.
Our technical check list:
- MACD is on a buy signal and rising.
- CMF sis solidly positive and above the zero line.
- Price is above the major moving averages we track the 50-day, the 150-day and even about to cross the 200-day moving average.
We do see some negatives.
- The price is at two resistance levels. The 200-day MA area and the area of past price support and resistance area.
- Volume is declining as we are in the peak of summer vacation season. Come September, with another probable interest rate hike, with all the market players back in town, we could see profit taking hit in the September and October time frame.
In the chart below we want to look at a two year-weekly chart of the SPY to see how that looks. Perspective is best viewed from multiple angles.
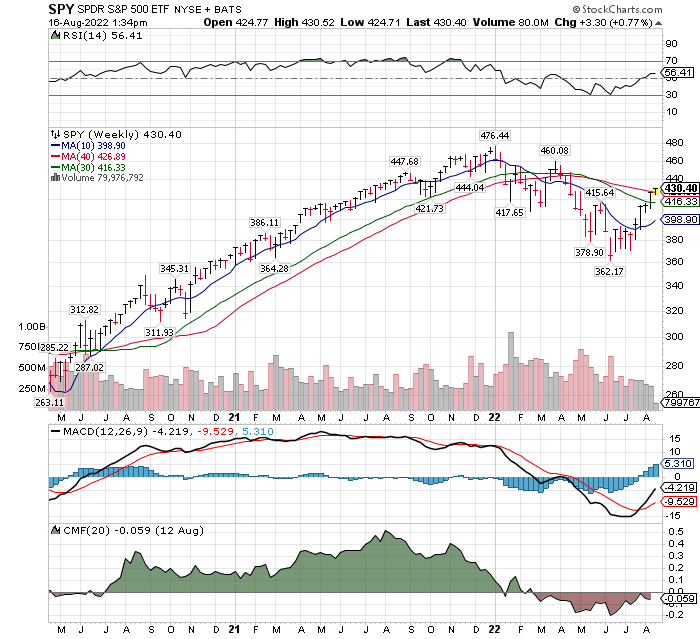 In the eye of the beholder? Is your glass half full or half empty?
Not a clear view but more bullish than bearish from a momentum perspective. More of a “be careful” situation. I suspect we will have a correction of some kind coming shortly. Probably within three weeks. Is it a correction that set the stage for now all time high in the S&P 500 or the beginning of the next leg down in the bear market / recession theme? The 150-day (30-week) moving average would be a down side target.
Fundamentally – earnings and revenue are not likely to look good over the next six months. We probably have time to buy into bad headlines in October ‘22 and again in February and March ‘23.
This is the one year N.Y. Empire State Manufacturing Index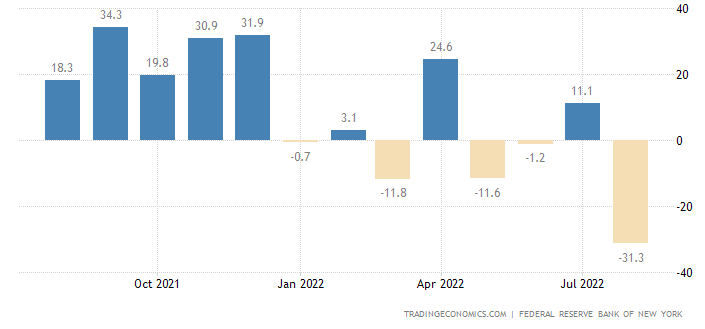
This is not headlines yet
In reading, listening and viewing various market gurus, the comments are mixed. More are starting to look at market technicals and saying the correction is a past event. There are still a number of good market analysts looking at economic activity, like the NY Empire State Manufactory Index above, and saying the worst of the correction is about to start.
Actions to Consider:
- Perhaps a time to consider selling call options against extended stock positions if stock options are available.
- Reduce Trading positions and activity until into September. Take a vacation from the market!
- Downsize or exit “non-core” positions.
- Take your losses in weak stocks. After all, if the stocks have not rallied as much as the market over the past sixty-days, why would they now? Take your loss and hold some cash or move to strong companies / stocks with better management metrics. If you like your companies that are down in price, you have a probability of buying them back after 30-days at lower prices. September is tax loss selling season for mutual funds and December is tax loss selling season for most of the rest of us.
Written August 16, 2022, by Tom linzmeier, editor, www.LivingoffTheMarket.com
LOTM Research & Consulting Service
* An account related to LOTM holds a position in this security.
Neither LOTM nor Tom Linzmeier is a Registered Investment Advisor.
Please refer to our web site for full disclosure at www.LivingOffTheMarket.com ZTA Capital Group, Inc.
To Unsubscribe please select “return” and type Unsubscribe in the subject line.
![]()