
![]()
-
Subscribe for our free daily newsletter
-
Recent Posts
- Bittensor (TAO) Vs Hyperliquid (HYPE)
- Two Areas to Buy Into: Digital Assets and Gold and Silver – Still!
- MARA Holdings* – A Stock of Interest
- Bitcoin Viewed from Technical, Sentiment and MoneyFlow Perspectives
- Comps and Projections for Galaxy Digital, DeFi Technologies and CoinShares
- LOTM Research Notes March 1, 2026:
- Summary of EQX and BTG recent earnings.
- A Slow Motion Portfolio Management Strategy
- Is ProShares Ultra Short QQQ (QID) at a Point of Change Alert?
- Real World/Real Time Examples of How Crypro & Blockchain are Impacting Traditional Payment Systems.
- Buy Signal Chart of the Day
- Bitcoin is Being Accumulated
- “Top Five” Fastest Growing Altcoin Networks
- Charts of Companies owned in different LOTM Portfolios Jan 23, ‘26
- Let’s Make a Million update (1.19.26) and comment on future changes:
- Major Brokers recommend a Bitcoin Allocation
- A Balance between Crypto/Blockchain and Hard Assets
- Summary:
- Bittensor (TAO) is HOT
- LOTM Predictions for 2026
- Key Update on the Price Action of Silver
- Focus on SOL Strategies (STKE) $2.00
- Contrarian View is to buy 20-year Treasuries.
- LOTM – Let’s Make a Million$ Update December 15th, 2025
- The Bitcoin to Gold Ratio suggests rotating “some” funds from Gold to BTC
- Solana: Leading Blockchain Activity and Revenue Growth
- Trade Alert! Forward Industries (FWDI)
- Western Union (WU) Value Buy or Value Trap?
- Three Must See Presentations On “Why Now, for Crypto!”
- Massive Insider Buying of Note
- Itaú Unibanco Holding S.A. ADR (ITUB)
- LOTM NOTES:
- If Your Timeline is Longer than six months – These names are TOO CHEAP!
- Opportunity in the Crypto Correction!
- Performance of three accounts related to LOTM
- Strong Buy Suggestion on AYA Gold & Silver
- Tough Days for Gold, Silver & Crypto/Blockchain
- Enormous Market for Crypto and Blockchain Applications
- Hard sell off on rising tensions between China and USA
- Gold & Bitcoin as Best Performers
- Difficult Choices!
- Positions and Performance dated September 22, 2025
- Changes in the Let’s Make a Million$ Club
- Timely activity or news in these companies:
- Why Invest in a Solana Treasury Company?
- Silver Mining Sector Emerges as Clear Winner Amid Production Expansion Wave
- Five converging innovation platforms that define the current technological era
- VanEck – NODE ETF Very attractive as long term holding!
- Americas Gold and Silver Added to our Buy Watch List
- An Interesting Idea – Pacific Biosciences (PACB) $1.31
- There are Four Major but Interacting Approaches to the Markets.
- Different ways the US Government is considering adding Bitcoin to the US Reserves in a budget neutral way.
- The “Hot” new Crypto Treasury company fad is the Ethereum Treasury Company.
- Bitcoin by the Numbers!
- Key Interviews this Week for Guiding Your Personal Investment Strategy
- Bitcoin Treasury Companies LOTM Finds of Interest
- Equinox Gold – Buy, Buy, Buy
- LOTM – Let’s Make a Million$ Update July 17th, 2025
- HealWell AI (HWAIF*) $1.05
- Actionable News on New Found Gold Corp
- The Two Most Powerful Videos This Past Week!
- Catching the Digital Transformation Tidal Wave
- Interesting Dividend Idea
- Interesting Dividend Idea
- ZTA Strategy Update – June 16, 2025:
- Two Divdend Ideas (Master Limited Partnerships) with Large Insider Buying (and I mean BIG BUYING)
- Outcrop Silver (OCGSF*) $0.19
- LOTM NOTES: May 23, 2025
- LOTM NOTES: DeFi Technologies In The News
- BitBonds for refinancing Treasury Debt
- LOTM: Bitcoin Headlines to Pay Attention To
- April 20, 2025 Update on ZTA related LOTM account with Positions Held
- In Commodities, The Cure for High Prices is High Prices
- IN THE NEWS:
- LOTM Related account updated positions and performance – April 4, 2025
- LOTM NOTES March 30
- How Bitcoin Price links to Human Interest / Fear Then Apathy Then Greed
- LOTM NOTES – March 22, 2025
- LOTM NOTES: March 19, 2025
- LOTM NOTES: March 13 2025
- LOTM NOTES: March 10 ‘25
- LOTM NOTES: March 7th 2025
- LOTM NOTES #2 March 4th ‘25
- LOTM NOTES #2 2.11.25
- LOTM Notes Sunday February 2nd 2025
- LOTM Note: Jan 20, 2025
- LOTM – Let’s Make a Million$ Update January 20th, 2025
- LOTM Notes 12/28/24: Birth of a New Monetary System
- LOTM NOTES from around here and from there:
- LOTM Notes 11/21/24 – Important update for all who own Bitcoin and Bitcoin Miners.
- LOTM: Everyone has an opinion – Here are some of the best on Wall Street, post-Election.
- LOTM: Comparing Ten Crypto/Blockchain ETFs. Which is best for you?
- LOTM Notes: October 30, 2024 – Bitcoin’s Big Move & Actionable Idea
- LOTM – Let’s Make a Million$ Update October 12, 2024 Review
- LOTM NOTES: It’s Just Life
- LOTM: Headlines, Thoughts and Actionable Ideas
- LOTM NOTES:
- LOTM Notes: October 06, 2024
- ZTA Ltd Partnership Performance – Strategy – Supporting opinions
- Corporations are starting to hold Silver & Bitcoin as Reserve Assets instead of Cash
- LOTM Spot Light on EarthLabs (SPOFF*) $0.172
- LOTM: Marathon Digital Vs Peer Group.
- Gold and Silver Mining Companies’ Target Price from TipRanks
- LOTM: Bitcoin – Gold and New ideas for the Future
- Three Headlines from Crypto-world Draw Attention
- LOTM NOTES: August 16, 2024
- Gold & Silver Miner Stock’s relationship to Physical Gold Price – The Ratio over 15-years:
- Countries with lowest Income & Wealth Inequality
- When Company News is Very good But the Stock Price Falls – NFGC
- LOTM Notes – July 11, 2024
- Galaxy Digital Should Be a ‘Core Holding’ for Digital Asset Investors
- Everything of Value will be Tokenized!
- Top Investment Stories of the Week ending June 8th
- Three Ideas all related to Crypto & Blockchain
- LOTM: Featured Presentations & Views from the Past Week
- GAME-on, The Bull Market in Precious Metals is Off & Running
- Update for LOTM: Ten Under $10, Games #1 and #2.
- Tokenization is Happening Now – Will You Profit from this Change?
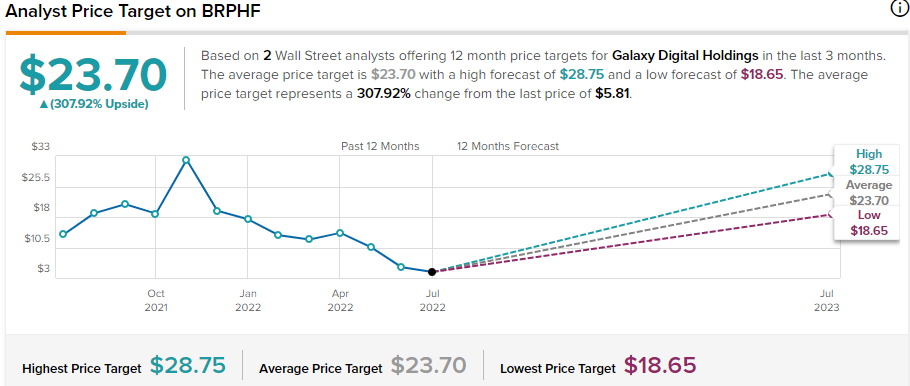
- Galaxy Digital (BRPHF*) $9.71
- Strong Trends emerging in Two Market Sectors
- Statement of Credibility for Bitcoin:
- (no title)
- LOTM: Must see interviews this week
- Galaxy Digital and Crypto Up-date from Mike Novogratz, Founder – CEO of Galaxy
- S&P Priced in Physical Gold – Game-on for Hard Assets
- Silver Stocks on the Move as are Gold Miners
- S&P 500 (SPY) divided by Gold (GLD)
- BEAR MARKET GO TO LIST
- Market Notes and Perspectives on What “might be” Coming Sunday March 10, ‘28
- Could the Silver Price Really Hit US$100 per Ounce?
- Seeking Alpha – Top Dividend Payers From the Top Rated
- Chainlink (LINK) is Rapidly being Integrated into Asset Tokenization
- Recent Headlines Involving Galaxy Digital – a LOTM Position.
- 3 Chart Trades Ideas: Over-heated – About to Break-out – Stage 1 to Stage 2
- Making your first Million – By Bill Powers
- News Worth Sharing – Feb 15, 2024
- CRYPTO & BLOCKCHAIN: Growth of a New Technology Eco System
- (no title)
- Galaxy Digital (BRPHF) $7.25 gets a bump higher price target at TipRanks there was a couple of weeks ago. Previous price target was to about $9.80 from one analyst. Now three analysts have price targets that average $12.32 – LOTM
- Which Spot Bitcoin ETF is the “One,” for You?”
- Themes, Perspectives and Views for 2024 Investing
- Ten Under $10 for the Double Update 12/22/23
- A Golden Cross for Physical Gold – Miners to Follow
- A True Growth Stock in the Making
- Fintech Ideas – running hot at the moment
- LOTM Technical and Quantitative Market Readings
- Consider a Stock Market (QQQ) Hedge that Pays you a 4% return
- Karora and Gold Rallies – Equities Topping, Michael Oliver, founder MSA
- LOTM: Highly Rated Dividend Stocks
- The Demand Vs Supply Bottle-neck Tightens in Crypto