
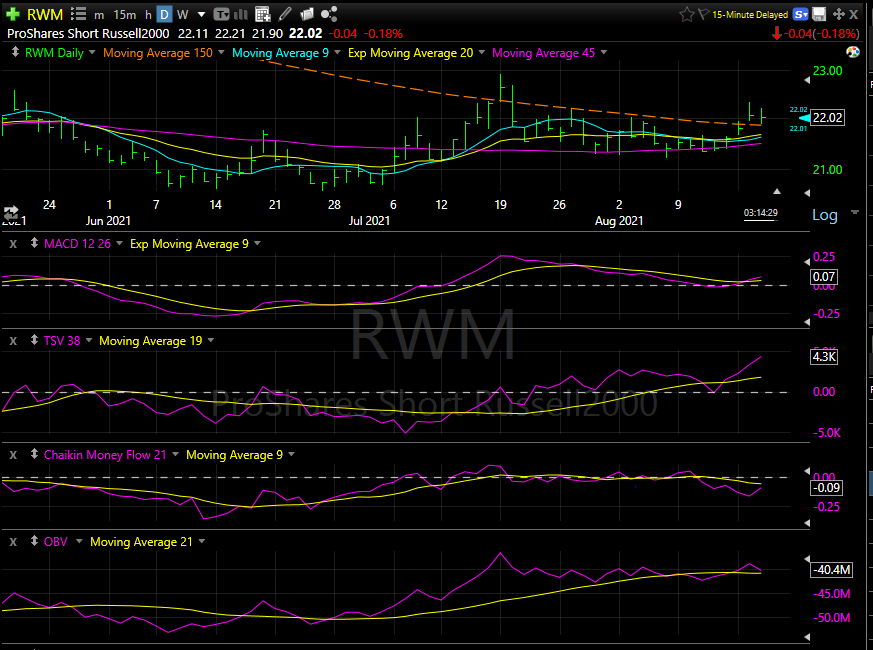
Chart from TC 2000
Aug 18, 2021 by Tom Linzmeier, editor LivingOffTheMarket.com
The broad market is still looking weak.
![]()
The chart above is the inverse ETF, RWM.
The trend of RWM is hitting our buy signals, criteria below:
- Price above major moving averages
- Shorter-term moving averages crossing above longer moving averages
- MACD on a cross-over buy.
- Two of three accumulation/distribution indicators (CMF – TSV – OBV) above their trigger line.
Know what you are trading: https://www.proshares.com/funds/rwm.html
Available for Coaching, Training or Mentorships
Contact LOTM For One-on-One consultations.
Rates are $125 per hour / less for retainer
LOTM Research & Consulting Service
Where Value meets Buy Signals!
Feel free to forward or recommend to others.
* An account related to LOTM holds a position in this security.
Neither LOTM nor Tom Linzmeier is a Registered Investment Advisor.
Please refer to our web site for full disclosure at www.LivingOffTheMarket.com ZTA Capital Group, Inc.
To Unsubscribe please select “return” and type Unsubscribe in the subject line.
![]()