
Follow -up: LOTM first brought ARKG to your attention on June 27, ‘22
ETFs are easier to “trade” using technical analysis Vs Individual companies. Why is that you ask? Individual companies have more variables to take in to consideration – like fundamentals. You want to check the fundamental factors when looking at individual companies. With an ETF it is more about the industry and money flows into the industry. Rising tide lifts all boats. Working an industry ETF is not as volatile as are working individual companies. That is a plus for some and a minus for others.
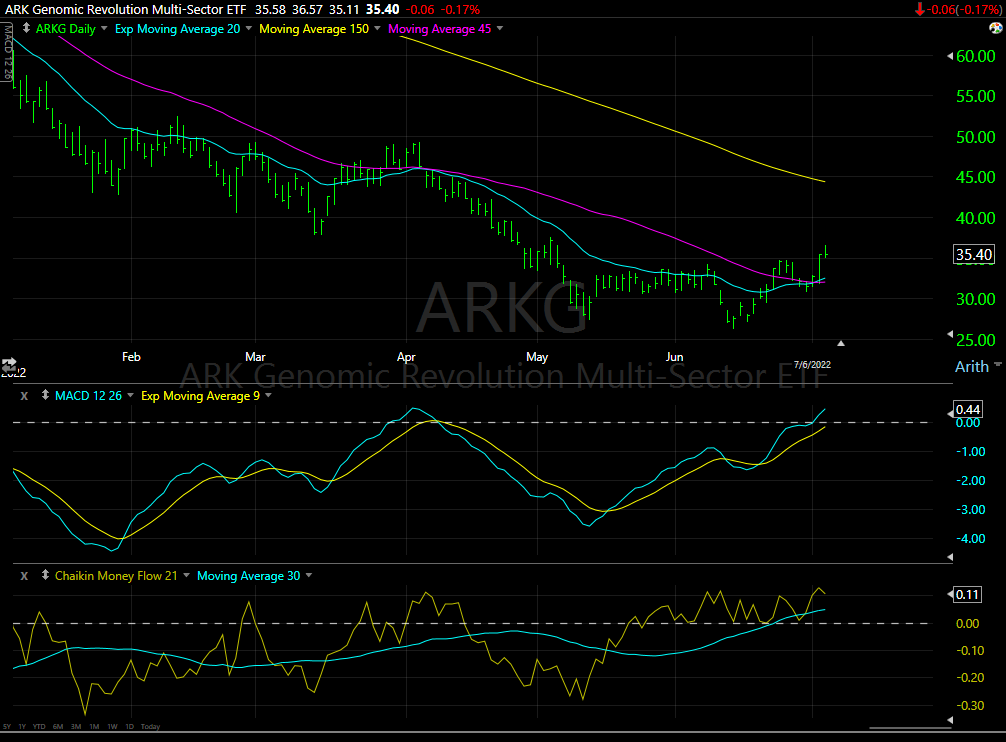
- We have the price above the 50-day moving average. This is a two to four month positive development.
- We also see the 20-day crossing above the 45-day MA. This is also a trend confirmation. It creates a higher probability.
- I like the MACD for short as a short term trading indicator. The fast line is above the slower line – a positive buy signal. Stable visibility
- For accumulation I like the CMF as a signal to make and opinion about trend accumulation or distribution. This indicator is showing accumulation. I use a 30-day MA to act as a stabilizer for the trend and it is rising.
It is still early in the basing pattern – Stage 1 – so we’d expect pull backs as buying opportunities. The momentum will build as chart pattern develops.
Shorter-term since June 1, ARKG has had three consecutive Higher highs – a positive though a very tight timeline.
A longer-term, two year weekly chart view (below) gives a better perspective on the industry’s money flows as it shows up in the ETF.
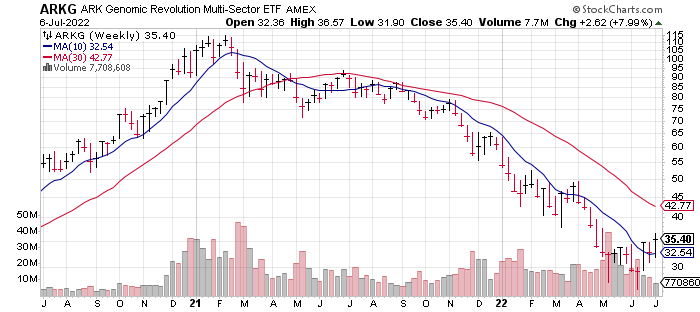
I would point out the surges in volume in Feb/March 2021 and again at the low in May 2022. Surges is volume often precedes changes in price trends at tops and bottoms. So far ARK is text book in this chart.
Resistance is around the 30-week moving average in the two year chart. The shares have traded as low as $26.38 in May. With the shares trading at $35.40 the price is up 34% off the low. This could be an over-sold bounce rather than the beginning of a new rally.
It is worth noting that for the past two to three weeks, Growth stocks have out performed Value stocks. Again, Is this a counter trend rally or are growth stocks sniffing out the possibility that we are past Peak Inflation. It’s too early to say. Hind sight, after all, is wonderful at telling us that.
Written July 6, 2022, by Tom Linzmeier at LivingOffTheMarket.com
Key words: #genomics #growthstocks #valuestocks #ETF #stocks #actionabletrade
LOTM Research & Consulting Service
* An account related to LOTM holds a position in this security.
Neither LOTM nor Tom Linzmeier is a Registered Investment Advisor.
Please refer to our web site for full disclosure at www.LivingOffTheMarket.com ZTA Capital Group, Inc.
To Unsubscribe please select “return” and type Unsubscribe in the subject line.
![]()