
As of March 3, 2026, the technical chart pattern for MARA Holdings (MARA*) indicates a short-term recovery or “bottom bounce” within a larger long-term bearish trend. While the stock has shown recent upward momentum, it remains under pressure from significant overhead resistance and long-term moving averages.
Current Technical Signals
The overall technical sentiment is currently Neutral to Sell, depending on the timeframe analyzed.
- Moving Averages:
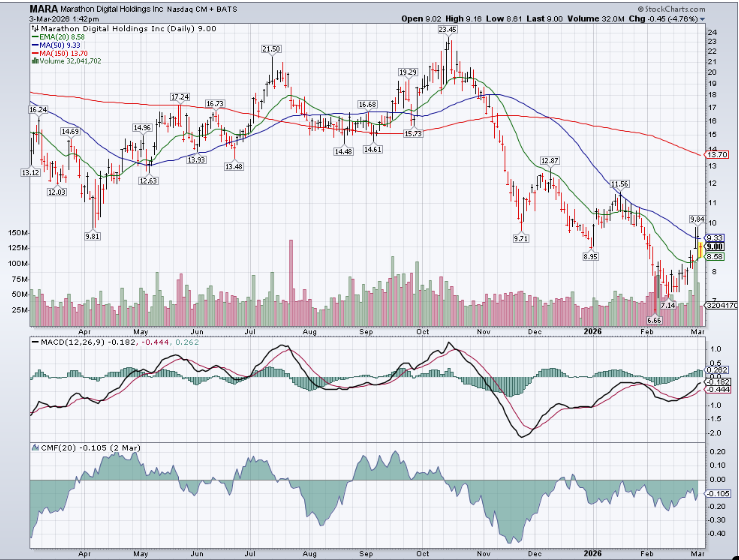
- Short-term (8-day, 20-day): Currently giving Buy signals as the price has recently risen above these levels ($8.16 and $8.11 respectively).
- Long-term (50-day, 200-day): Remains firmly in Sell territory. The stock is trading below its 200-day SMA of approximately $14.46, indicating a persistent long-term downtrend.
- Oscillators:
- RSI (14): Sits around 46–52, signaling a neutral position where the stock is neither overbought nor oversold.
If you are interest in owning MARA “ The Company” for long term capital gains we like this chart pattern and would dollar-cost average int o the position especially on weakness.
If you are more of a trader or trend following buyer / owner, we’d wait for the price to approach the underbelly of it 50-day moving average and buy more aggressivly on a two day or three day close above its 50-day moving average. The computers will react faster than that as they are programed to buy at a price ccossing the 50-day MA. You choice on how sensitive you want to be with the signal. Currently the 50-day MA is at $9.33. This would move the buy signal from buy a very short tersignal (20-Day) to going on to an intermediate term 50-day) buy signal.
The chart pattern is moving counter to the bitcoin trend and to the general market trend as doneward for Technologiy stcoks.
NOTE the MACD is in a rising pattern even as the stock was falling in the December 2025 to present time period. This shaows the stock has been under accumulation during that period.
CMF (Chaikin Money Flow) also shows less intense selling in the same period as mention above for MACD. This also shows an improving pattern in a period when the stock price was making lower lows.
The stock price could spend time moving sideways for three to six months but it is probable that the low price for 2026 was $6.66 in February of 2026.
MARA Holding is considered an energy management compay. They produce about 70% of their own electicty from wind solar and Nat Gas for their own crypto Mining and AI Data Centers while also being able to supply electricity on demend to their respective local grid system. MARA is international in its power generation, crypto mining and AI Data Center busineses. They remain the second largest own of Bitcoin from the global public company description. Maintaining their Bitcoin position is of lower importance than building out their Power Generation & Management and AI Data Center business.
Company web site: https://www.mara.com/
Finviz MARA link: https://finviz.com/quote.ashx?t=MARA&ty=c&ta=1&p=d
March 3, 2026 – MARA Holdings* 10-K outlines 2026 shift to sell balance-sheet Bitcoin to fund operations and AI infrastructure expansion news linked here.
LOTM Research & Consulting Service
* An account related to LOTM holds a position in this security.
Neither LOTM nor Tom Linzmeier is a Registered Investment Advisor.
Please refer to our web site for full disclosure at www.LivingOffTheMarket.com ZTA Capital Group, Inc.
To Unsubscribe please select “return” and type Unsubscribe in the subject line..
![]()