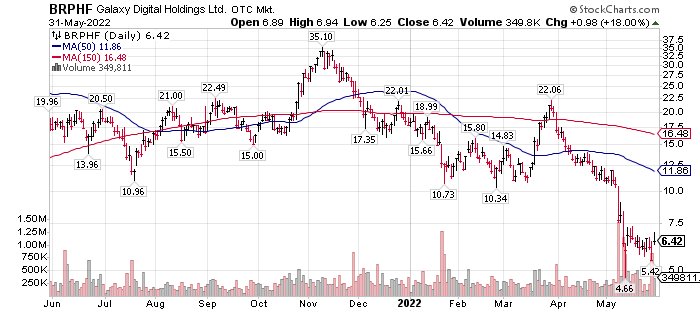
Traditionally, analysts issue something like a Buy, Sell or Hold opinion. Analysts don’t want to make enemies of Management teams for the companies Continue reading
![]()

Traditionally, analysts issue something like a Buy, Sell or Hold opinion. Analysts don’t want to make enemies of Management teams for the companies Continue reading
![]()

This group has had an amazing selloff since they topped out in February of 2021. More than a few babies thrown-out with the bath water. Continue reading
![]()
Bonds/ Equities/ Gold/ Bitcoin
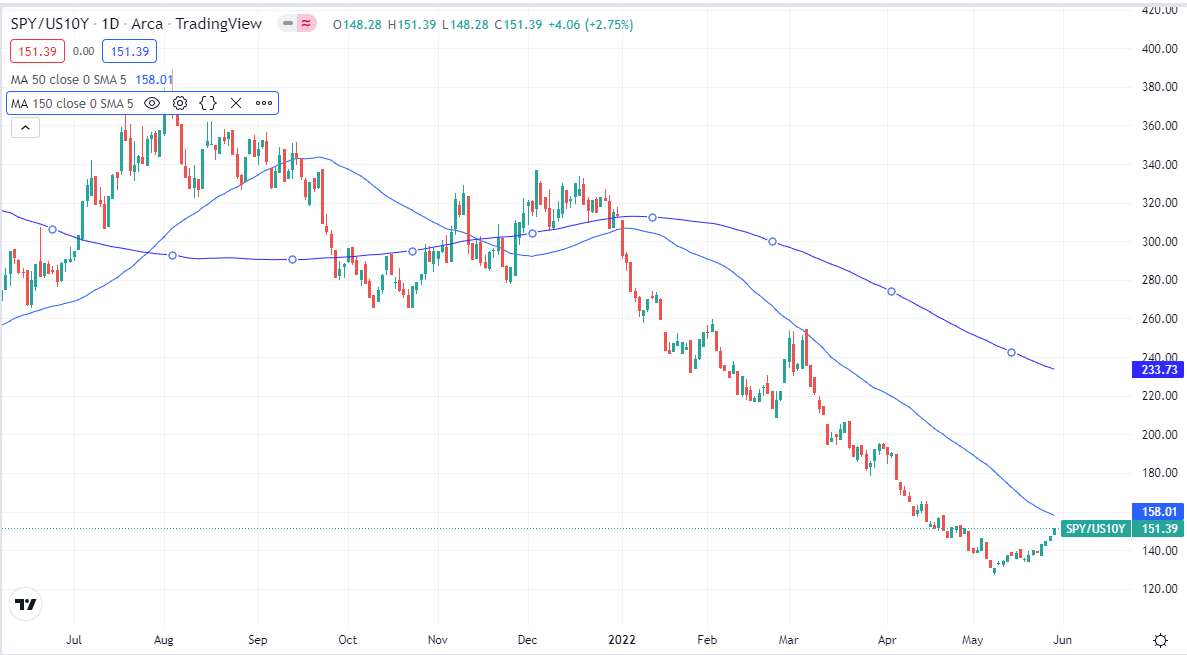
S&P 500 / Ten Year US Treasury Yield with 50-day and 150-day moving averages.
The Stock Market as seen by the S&P 500 Continue reading
![]()
We all need to reinforce our beliefs once in a while. Especially when we have money on the line. So, I did a quick review of Blockchain and some of the companies involved with Blockchain.
I looked at company participants to see if or what they had publicly said about their involvement in Blockchain. Before I do that, I would like to expand on the LOTM approach to Blockchain and Crypto. Continue reading
![]()
Soluna Holdings – a Ten Under $10 for the Double position – a ten-x position at the current price. Continue reading
![]()
Asset & Industry Rotation: Continue reading
![]()
I have placed a number of Cathy Wood’s Genomic stock picks in a watch list. The purpose was to monitor them for an attractive entry point. It appears that a bottom might have been found. Ask me again in 90 days to confirm that. Wood’s Ark Genomic ETF symbol is ARKG of course. Closing price Friday was $32.67. The weekly two-year chart looks like this. Continue reading
![]()
Picking a market top or a market bottom is really tough, yet here I am say or maybe suggesting a market bottom has been made in the last two weeks.
Something Broke – Terra Luna broke last week. People close to Terra Luna are trying to fix it, but a lot of psychological damage has been done. Bitcoin saw 2.4 Billion US Dollars’ worth of coin trade a week ago Thursday. That is certainly a panic sell by someone. Terra Luna. More importantly is the question – who bought. The price of Bitcoin dropped from around $30,000 to $25,000 and came back to $30,000 in about 24 hours. This week Bitcoin sold down to just under $29000 and seems to be holding. No bottom is complete until we can look backwards and see the price moving higher and out of the low price area. We will need to see the price cross above $31,000 and $32,000 for that. Continue reading
![]()