
We are very close to crossing the line to a Debt Based Spiral
The Bond market, globally, is about four times larger than the global equity Markets. What happens in the debt impacts the equity markets.
The Federal Reserve has lowered interest rates in 2024 however the interest rates on US Ten-year Treasuries have risen. This increase in “market rates” is influencing the strength of the US Dollar. It is causing the US Dollar to rise. The majority of debt globally is priced in the US Dollar. Debt outside the USA, priced in US$ must be paid in US$ so there is a scrabble to gather US$s. Local currencies outside the USA fall as the US$ rises, so the cost to service debt rises when priced in local currencies. The scramble for US$ by debtors outside the USA pushes the US$ higher as seen in the chart below. The October 2024 to present time period is referenced.
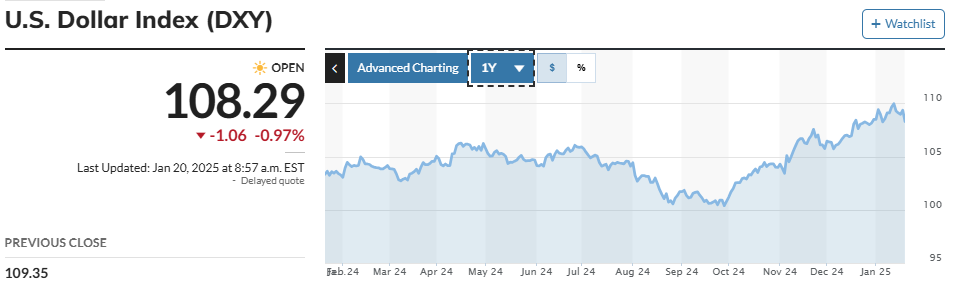
Chart source is from MarketWatch priced Morning Jan 20, 2025
Today, January 20, 2025, the US$ is backing off from its recent highs. Perhaps it is an emotional response to the Inauguration of the Trump Administration. It is important to observe, however, over the next couple of weeks what the US$ does. Should the Ten-year Treasury interest rate cross above the 5% to 5.25% boundary, it will be very negative for global liquidity. Bond prices will fall followed by a drop in equities followed by a drop in physical Gold and Silver. Yes, certainly crypto will be hit as well. In the old days it was called a credit crunch. Today perhaps it is called a liquidity squeeze.
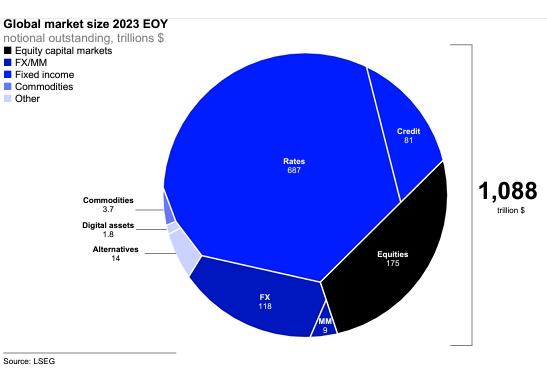
Remember the bond market is four times the size of the equity market. A quick search of bond to equity size of market popped up the following numbers: Rates (debt) are about $687 trillion plus credit (about $81 trillion) combined is $768 trillion. Global equities are about $175 trillion creating a ratio of 4.39 to 1 – debt to equity. As shown in the graphic below, commodities and digital assets are tiny Vs debt and equity markets. Numbers shown are at the end of 2023.
What happens in the Bond markets is important but doesn’t matter until it matters. We are approaching numbers and events that matter. 5% on Ten-year Treasuries matters. Ten-year Treasury market rates rising when the Federal Reserve is lower rates – matters.
As of now they are in an early warning phase. The more we are aware of this the less likely it will be a problem but it is important to understand where we are so we can act – if we want to act. Being blind-sided is less fun than knowing what might happen.
Source linked here
Interviews with three people who have been spot on in describing macro developments in Bond, Equity, Commodity and Digital assets, are linked below. It is worth the time to listen to the first ten minutes of each interview to get a broad understanding of what might happen. Hopefully, we will back away from the edge but to paraphrase Michael Howell from his interview below; “the trend for equities is still up but I’m dancing very close to the door.” I believe many professional asset managers have the same perspective.
“Liquidity Crunch Threatens ‘Everything Bubble’ with Michael Howell”
“The Bond Vigilantes Are Back & Rejecting The Fed | Jim Bianco”
“Dollar Squeeze Is Causing “Debt Spiral” In U.S. Bond Market, Argues Luke Gromen”
An easy place to check the interest rate on ten-year treasuries is at https://fred.stlouisfed.org/series/DGS10
The current rate on ten-year treasuries is about 4.61%. The danger levels are 5% and then 5.25%. Once we get – if we get to 5%, we can expect a sharp downward reaction in the stock markets.
This is only sent as a warning of possible danger to the stocks market, if we see ten-year treasuries cross above the 5% level. At this time, we still have sunny skies shining above the stock market.
I would like to close this note by sharing a longer term observation. While we have the graphic above of the capital markets posted above, note the size of the debt, credit and equity markets in the graphic above. Add in the real estate and auto market. Note the size of the “digital asset” market in comparison to the other markets in the graphic above. Consider that every stock, every bond, every credit instrument, every commodity and every title to real estate and vehicle will be connected to a digital blockchain…
That will give you an idea of how much growth there will come to the crypto and blockchain (digital) industry in the next five years. And that is only for registration and transfer applications. Food for thought.
Enjoy the day. Tom
![]()