Bonds/ Equities/ Gold/ Bitcoin
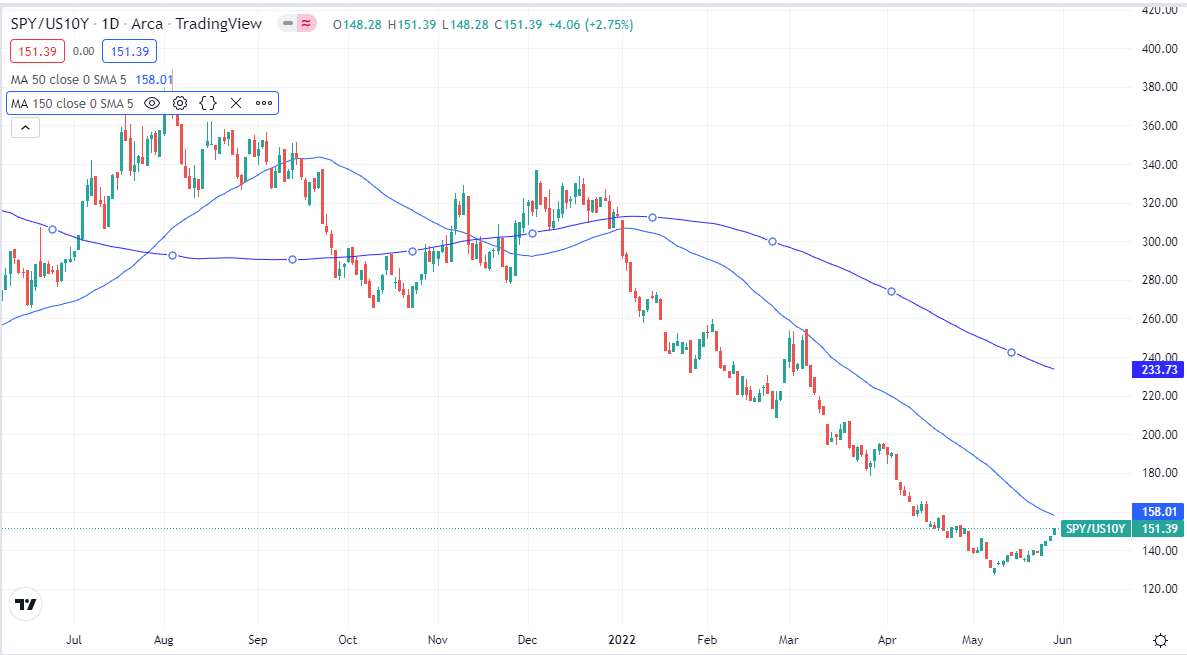
S&P 500 / Ten Year US Treasury Yield with 50-day and 150-day moving averages.
The Stock Market as seen by the S&P 500 above, started its decline well before the Fed began raising interest rates. The chart is a visual of the S&P 500 divided by the Ten Year Treasury Yield. I would suggest a couple of things from the chart above. One, “The Market” chart-wise, is a long ways from giving a trend-following buy signal. Two, watching the treasury market yields and prices is superior to watching Federal Reserve action.
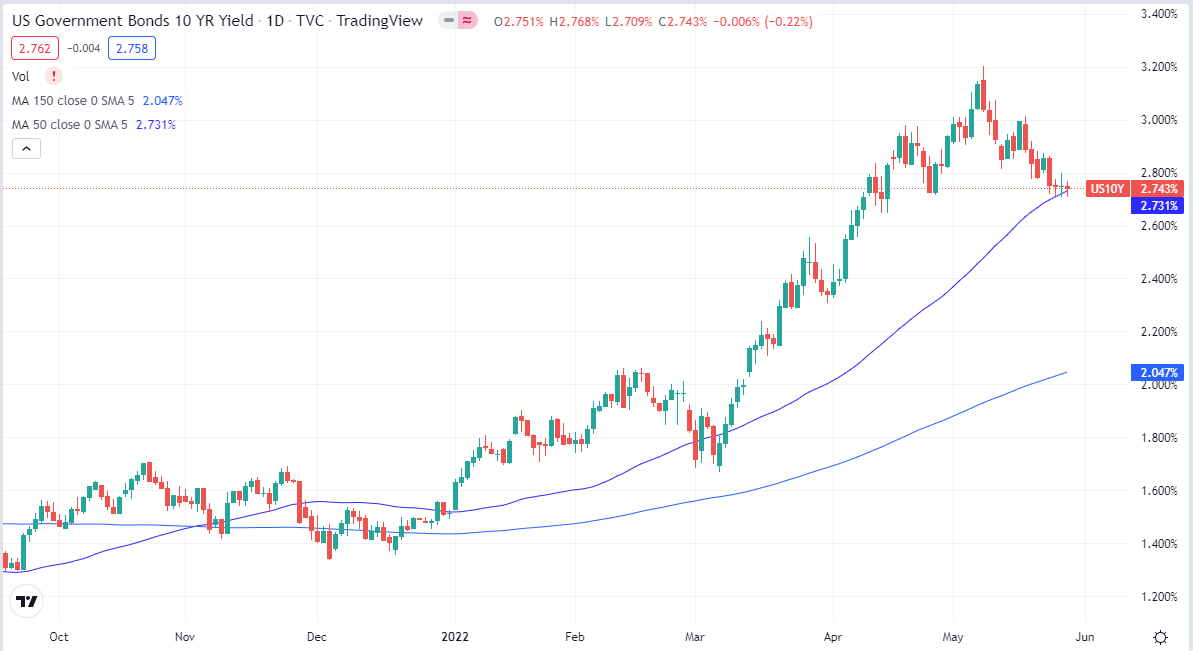
- If we do look only at the Ten-year Treasury Yield, below, it does look like a top is forming, on its yield.

The trend has not changed – the yield is still above key moving averages – but the stock market rally in May corresponds with a slight lag to the change in the yield of Ten-year Treasuries.
We will watch and learn a lot following the Fed Meeting in June. It is expected that the Federal reserve will raise its bench-mark interest rates by 0.5%, possibly 0.75%. that is expected so no “surprise” should it happen. A half present price hike would take the Fed funds rate to 1.5%. Still below the ten year treasury rate. Should the Ten year treasury rat remain below 3% with a hike to 1.5% or 1.75% on the Fed funds rate, we believe this is bullish for equities.
The next Fed meeting is June 14-15.
LOTM believes Gold and silver are safe haven assets. Physical Gold is our top pick for safe haven asset. Gold and mining stocks are 2 to 3 fold more volatile than physical gold. This can be a positive of negative depending on your financial goals. Roughly speaking, Physical Gold is up about 1.2% in 2022. Gold mining stocks are down about 14 to 15 percent in 2022.
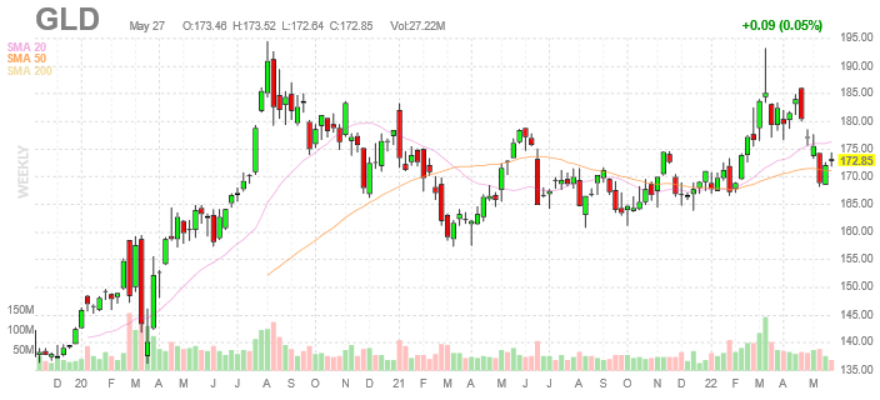
Technically speaking, Gold broke out in 2020, consolidated through the 2nd of 2020 all 2021 and rallied to the top of the consolidation pattern in March 2022. The current pull back in my analysis is an opportunity to buy gold with the conclusion that the next rally up will break out above the top of the March 2022 high. Gold along with some other natural resource related items are the best performer so far in 2022.
At this time, Crypto, Bitcoin and Ethereum, are risk-on assets, the same as growth stocks. While bullish on Blockchain and crypto, we are placing them in the high potential growth category. This will likely change as the industry matures and the network of use for the individual crypto expands and stabilize.
Morgan Creek Capital founder, Mark Yusko, has modeled Bitcoin valuation prices since 2014. The model looks at the size of network and use of Bitcoin to determine its value. Currently, Yusko’s team has a $32,000 to $33,000 valuation price on Bitcoin. Attractive number for buying bitcoin. His comment can be seen at the 45 minute mark to 49 minute mark at this linked YouTube discussion. An additional kicker to the conversation is that Bitcoin has only been this cheap relative to the model price, 6% of the time. The disclaimer is this is not to say Bitcoin cannot go lower.
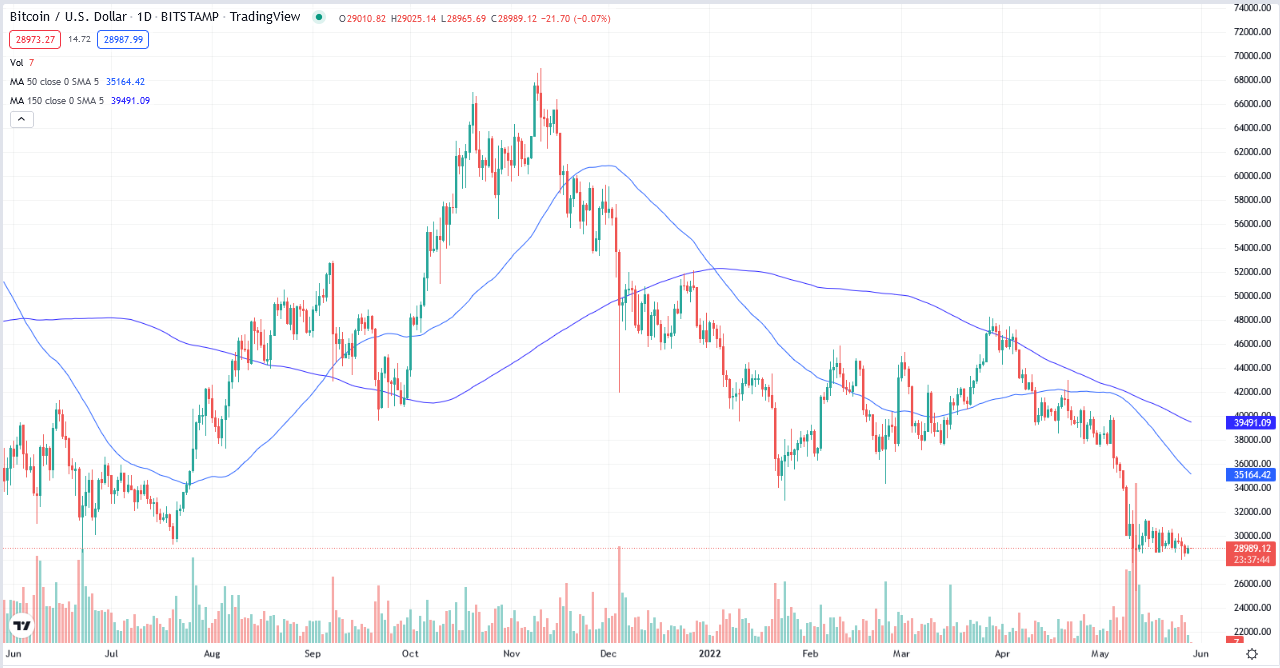
Bitcoin Chart.
The chart below, is not a pretty chart for Bitcoin. The majority of time this chart pattern breaks to lower prices. Bitcoin might be below its modeled valuation but nibble if you are a buyer until the price breaks up or down. Longer term Bitcoin has a high probability of trading to new all-time high prices. It is still in a declining chart pattern for this cycle. The cycle is “probably” 55 to 60% complete in time measurement.

LOTM has shifted to an annually payment model starting June 15th. The one time annual cost for LOTM will be $273.
We will provide you with ideas in industry sectors and individual stocks that combine an attractive valuation with the upside to potential to double in a six month to twenty-four month period. We also love our dividends.
Payment instructions will follow after the Holiday weekend.
LOTM Research & Consulting Service
* An account related to LOTM holds a position in this security.
Neither LOTM nor Tom Linzmeier is a Registered Investment Advisor.
Please refer to our web site for full disclosure at www.LivingOffTheMarket.com ZTA Capital Group, Inc.
To Unsubscribe please select “return” and type Unsubscribe in the subject line.
![]()
