
One-Year – Five-year & Ten-year performance
QQQ – GDX – Physical Gold & Bitcoin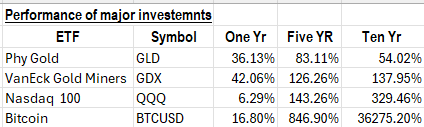
Numbers in the charts below will be slightly different then the grid above due to time (less than one hour) selected. The price leverage over longer time periods make a big difference. It is important to understand this benefit of long-term position building due to the human desire for excitement and drama fueled by the swings between fear and greed, that drives us to trading Vs long-term position building.
In the short-term (one year or less) Physical gold and Gold Miners are out performing the NASDAQ 100 and Bitcoin. On the longer time periods, history (last ten years) shows that NASDAQ 100 (QQQ) and Bitcoin are the top performers.
Projecting into the future we need to consider what exposure we want in different investment categories. Investment related to gold and silver can be very cyclical with long periods of out-performance but even longer periods of under-performance. Presently Gold / silver investments are out-performing.
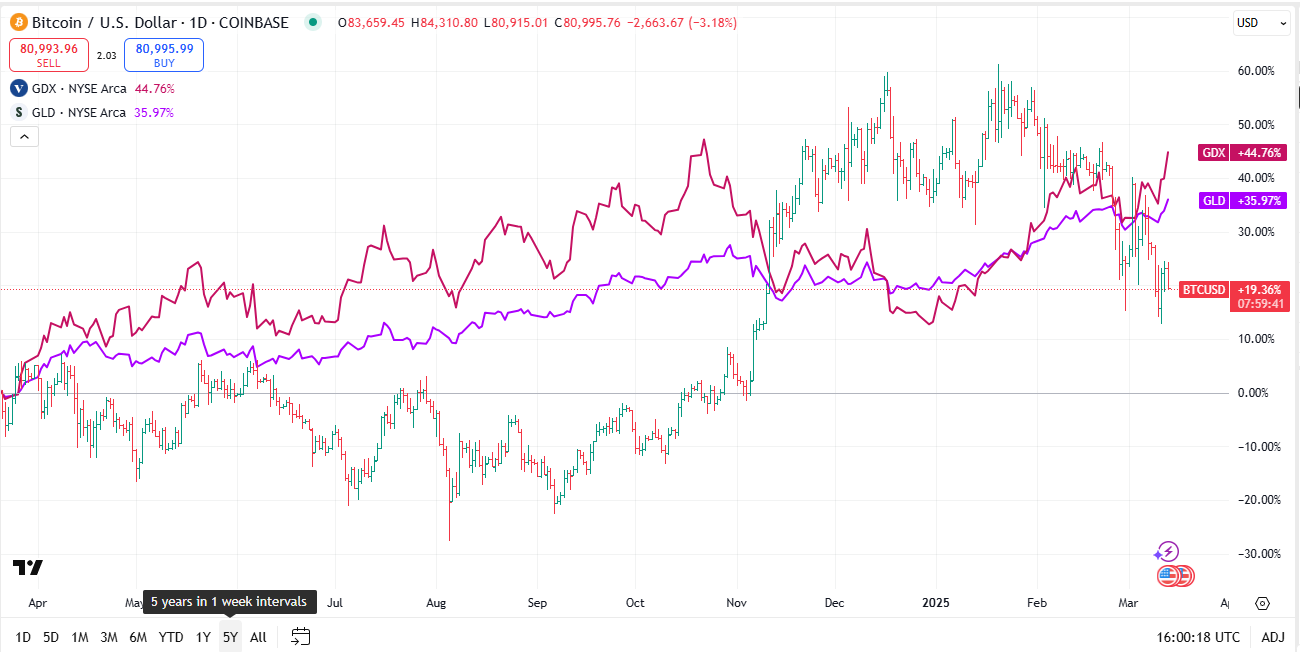
One-year chart below of Bitcoin, GDX (VanEck Gold Miners) ETF and GLD (Physical Gold) ETF.
Five year chart below of the same three investments.
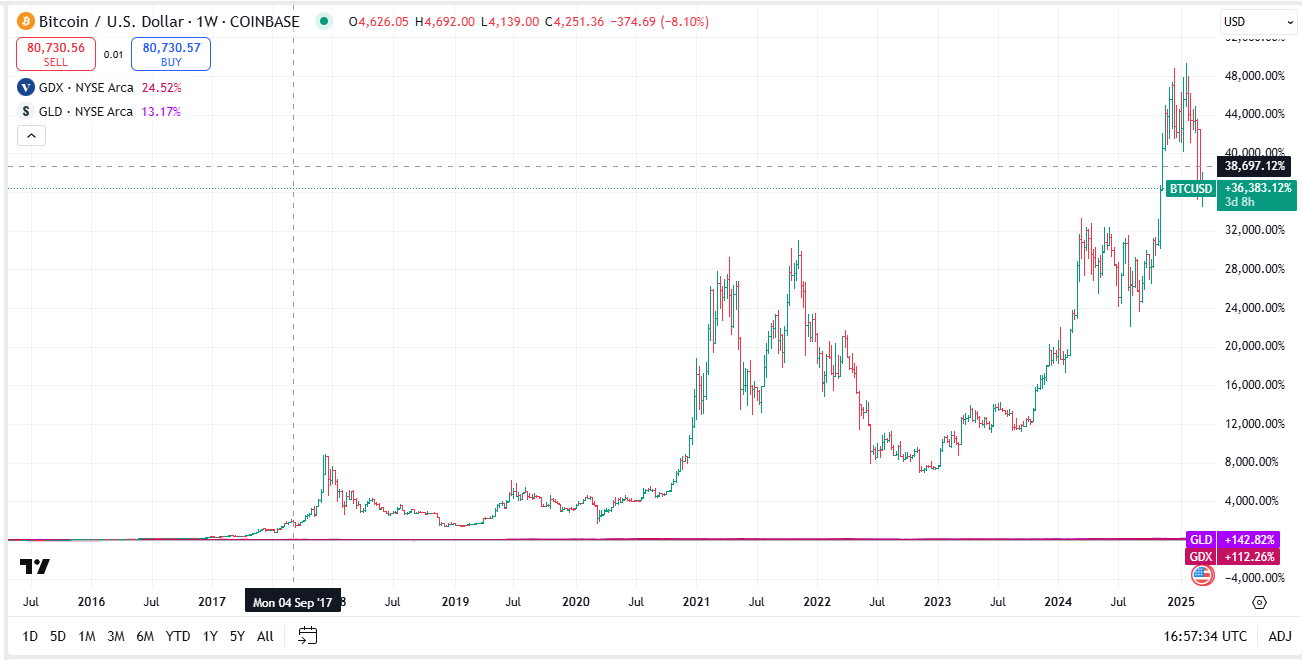
Ten-year chart below of same three investments
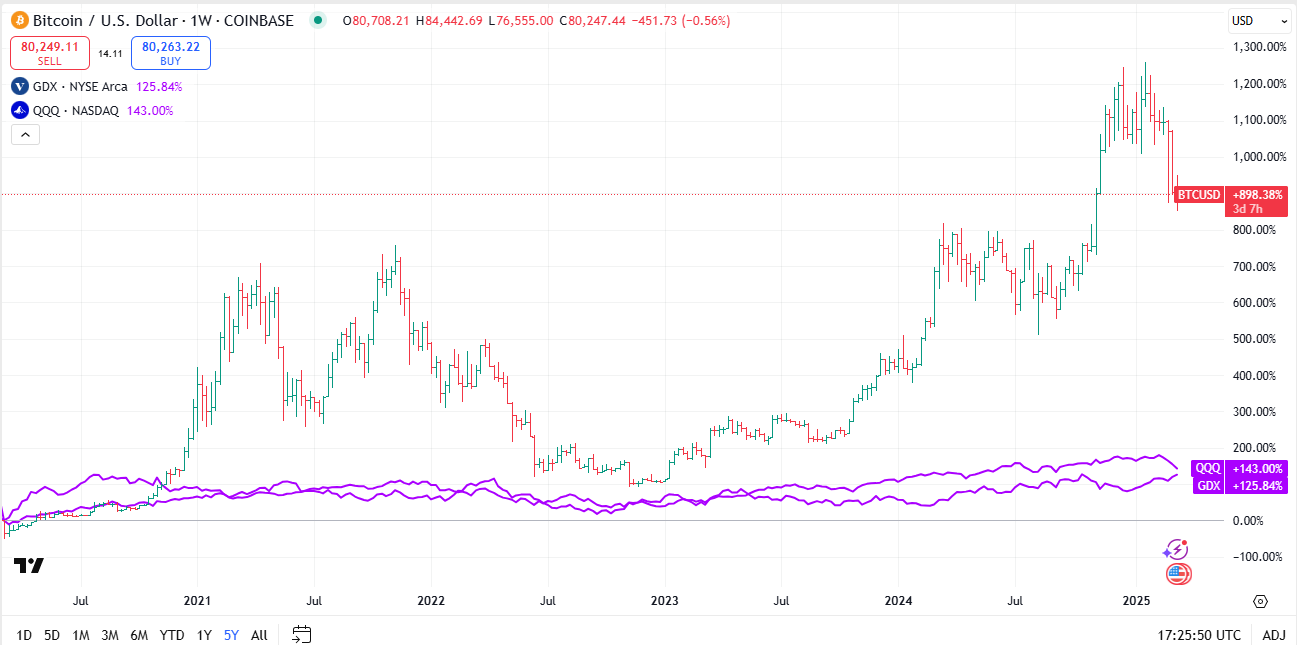
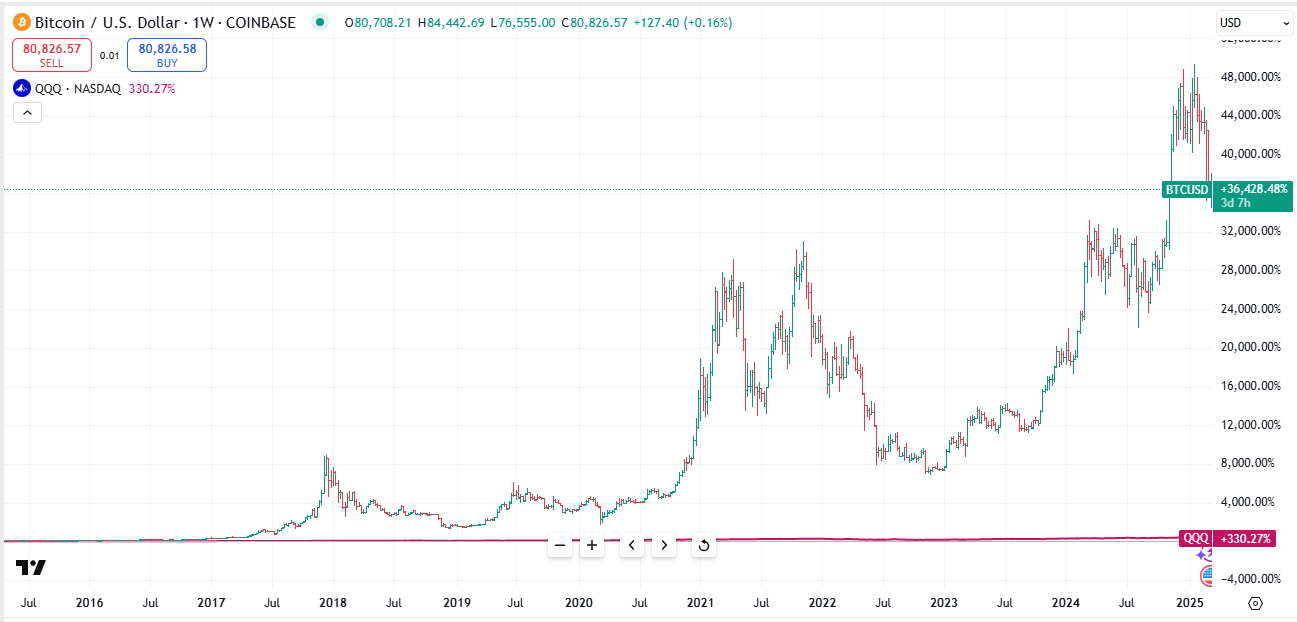
Some are wondering how Bitcoin did against the QQQ which has the Magnificent Seven stocks in the index. Below is a chart of the Bitcoin and the QQQ (NASDAQ 100)

![]()