
Unloved and over-sold, XBI the S&P Biotech ETF, is attractive for a short-term over-sold bounce and a long-term accumulation perspective.
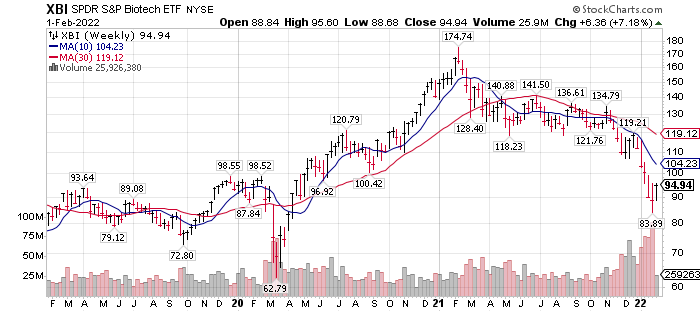
XBI is trading at $94.94 down from one year ago when the price hit $174.00. The recent low was on the morning of Friday, January 28th at $83.89. It’s been a bad year for Bio Tech and now your buying opportunity! Other people’s fear and disgust is your delight.
XBI is an equally-weighted ETF Vs IBB, a Market-cap weighted Bio Tech ETF. This is an advantage when playing in the Bio-tech area as small companies hold equal-weighting with mega-cap industry leaders. Why does this matter? Because we are moving into an active investing era. Over the past decade we experienced passive investing era. This allowed big money to pile in the top ten stocks of an ETF and control 35% to 45% of the movement in a Market-weighted ETF. Small companies influence in the ETF was drown out. In Bio-tech especially, you want the small Bio-tech positions because that is where the innovative technology is developed. Buyouts in Bio-tech are where you make sudden, and large percentage gains. You want to capture that. The impact of buy-outs is more pronounced in an equally-weighted ETF.
The month of January 2022 and the year 2021 was a bad time to own Bio Technology. While the market has not warmed up to Bio-tech yet, we see the technical signs are there to begin building a position.
- First, of all the bullish sentiment / momentum is not present. Gives value buyers the opportunity to buy.
- Second the sector is over-sold when comped to the other market sectors.
- Third, Selling Volume peaked in January 2022 with the price going lower afterwards. Volume precedes price.
- Fourth, we are seeing a bounce. A second drop to test the lows would be a great and classic entry point. No one can say it will happen. If it does not happen it just confirms what is said here, sooner rather than later.
LOTM suggests buying a small trading position in the event BTX keeps rallying (up eleven-dollars in the past two trading days) and dollar-cost averaging over the next few weeks on weakness if the stock pulls back. If we are right and the price drops and rallies again, we would buy more aggressively, if price goes higher than the initial bounce rally. This would confirm a longer-term bottom.
Looking at the chart below you can see the symmetry of the top in February 2021 and the bottom on January 28th, 2022, with the downward correction being between the two dates. We think this is significant.
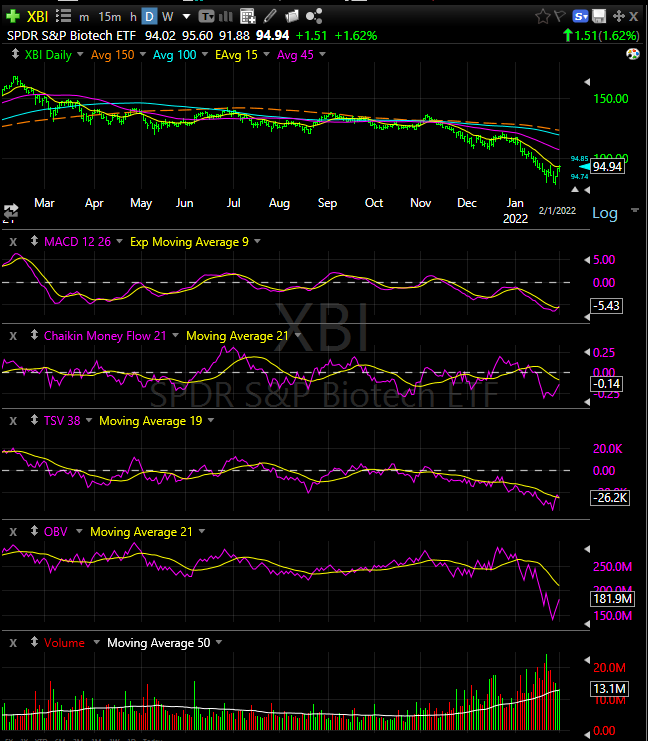
Chart from TC2000.com
Your thoughts? I am usually early and anticipating. Bear that in mind!
You can Read, you can watch Videos, but nothing beats Personal Interaction for accelerated learning.
This game has levels of understanding that could take a lifetime of Trial and Error to learn.
Available for Coaching, Training or Mentorships
Contact Tom through the LOTM website or by email
Rate: $150 per hour / Monthly Retainer, Lowers Rate
LOTM Research & Consulting Service
* An account related to LOTM holds a position in this security.
Neither LOTM nor Tom Linzmeier is a Registered Investment Advisor.
Please refer to our web site for full disclosure at www.LivingOffTheMarket.com ZTA Capital Group, Inc.
To Unsubscribe please select “return” and type Unsubscribe in the subject line.
![]()