Vehicle: ProShares Short QQQ ETF
Price: $10.10
Purpose: Short-term trade in anticipation of a market correction or longer-term hedge
Dividend: This short position on the Nasdaq 100 (QQQ) pays a quarterly that presently is about 4% annually.
How can it pay a dividend? The ETF does not short the QQQ directly but rather through various duratives. The balance of the ETF, is in short-term Treasuries. The return on short term treasuries is high enough at this time to pay the current dividend.
History: Since the history of the Nasdaq 100 (QQQ) has been in a decade long uptrend, the long-term performance of the PSQ has been negative. This appears to be a vehicle to use on a shorter-term hedging basis when you believe a market correction is close at hand.
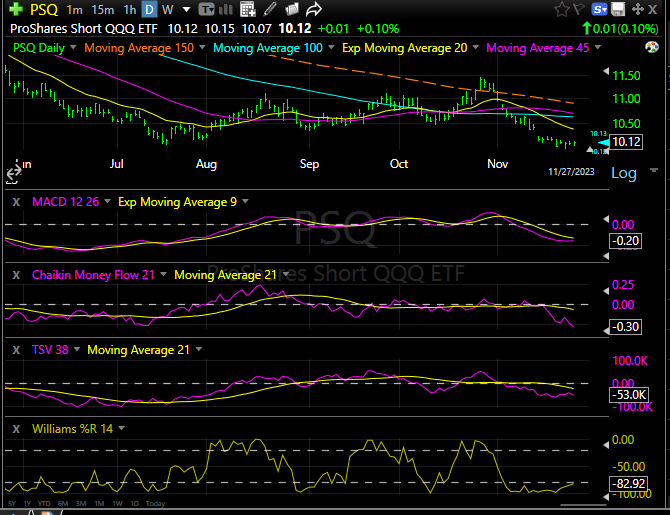
Two indicators you might consult for helping with timing are the Williams %R (WM%R) and the Chaikin Money Flow (CMF). In the charts below, the first chart is a daily chart, and the second chart, is a weekly chart. The indicators, WM%R and CMF are slightly different in each chart due to the time variation between Daily readings and Weekly readings.
WM%R is a short term oscillator that shows over-bought and over-sold readings. This is not a trend following signal and should the PSQ trend, this indicator can stay over-bought or over-sold for a long period of time. It is best to use this indicator for trading over a one to three week period or as entry or exit signal in a longer-term trend. Williams %R appears close to a buy signal in the daily chart below.

Chaikin Money Flow (CMF) is an accumulation or distribution signal and as such is a better signal of longer-term position accumulation or distribution of shares by larger players in the market.
MACD is a variation of Wm%R, hence a short term trading signal. TSV (Time Segmented Volume) is a variation of the CMF signal, so more of a trend reversal and trend following signal.

Our projection for the general market is that the market can maintain and rise slightly into year-end but Q1 2024 will be more difficult for the market.
In a related account, we have a small position in the PSQ based on current signals however we are not expecting much price action until four to six weeks from now. We are assuming nothing of a negative surprise happens in the market from now until early July. A dangerous assumption for sure. Anything can happen and is usually a surprise when it does happen.
In general, ETFs such as the PSQ that use the futures market for its holdings are not suitable to buy and own. They were designed as trading vehicles. In this case and at this time, the 4% dividend helps offset the time decay inherent in futures or option contracts. Never the less have an exit strategy decided and ready to execute before placing the entry trade.
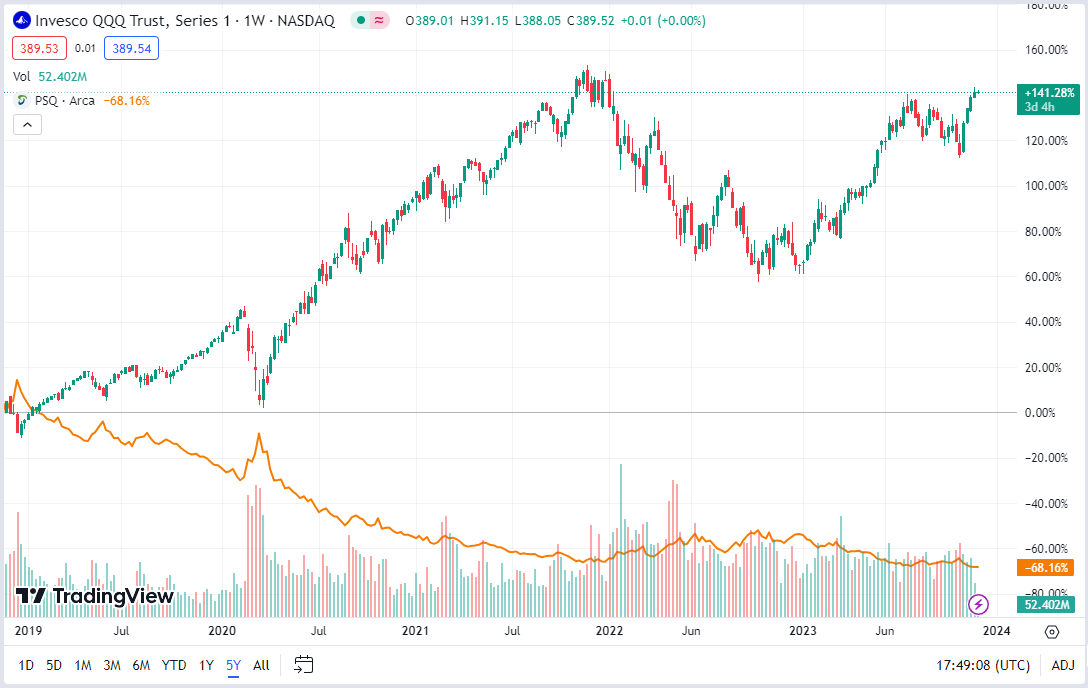
Below is a chart of the QQQ with the PSQ added from TradingView. You can get a feel for how the two dance together or separately from the picture.
The long term trend as seen below for the PSQ and QQQ, is not pretty. Should the QQQ enter a prolong decline, the two declines should reverse this image.

Seven stocks represent 40% of the 100 stocks listed in the QQQ. These seven are Apple (AAPL), Amazon (AMZN), Microsoft (MSFT), Meta Platforms (META), Google (GOOGL), Tesla (TSLA), and Nvidia (NVDA).
It is not healthy to have seven (7) companies out of 100 have a 40% impact on the group. You may or may not want to short this index for this reason.
On the other hand, if you feel the Magnificent Seven companies above, have had their day in the sun and are over-priced and ready for a longer-term correction, this might be just the right vehicle with a dividend added.
Stop losses are recommended when trading “stocks.” If you are building share position in “companies,” you might consider Dollar Cost Averaging (DCA) as a risk management tool. Know your company, stock and plan of action.
For Actionable Stock Ideas, consider a subscription to Tom’s LOTM Blog.
LOTM Style – We are more a controlled speculator, than diversified investor or short-term trader. We allow 100% loss/risk on some purchases. Often, we dollar-cost-average into losing positions. Volatility is our friend, not something to be feared. We let our winners win, as much as possible. We do not like paying taxes. We love value, yet watch charts. Our goal is to find value stocks that might double in one to three-years.
Written November 28, 2023, by Tom Linzmeier, for Tom’s LOTM Blog at https://lotm.substack.com/.
Accounts related to LOTM and Tom Linzmeier can & will, buy or sell securities at any time.
LOTM Research & Consulting Service
* An account related to LOTM holds a position in this security.
Neither LOTM nor Tom Linzmeier is a Registered Investment Advisor.
Consult your investment advisor for investment advice appropriate for your situation.
To Unsubscribe, please select “return” and type Unsubscribe in the subject line.
Tom’s LOTM Blog page https://lotm.substack.com/
![]()
