
Technical Comment on the Chart below.
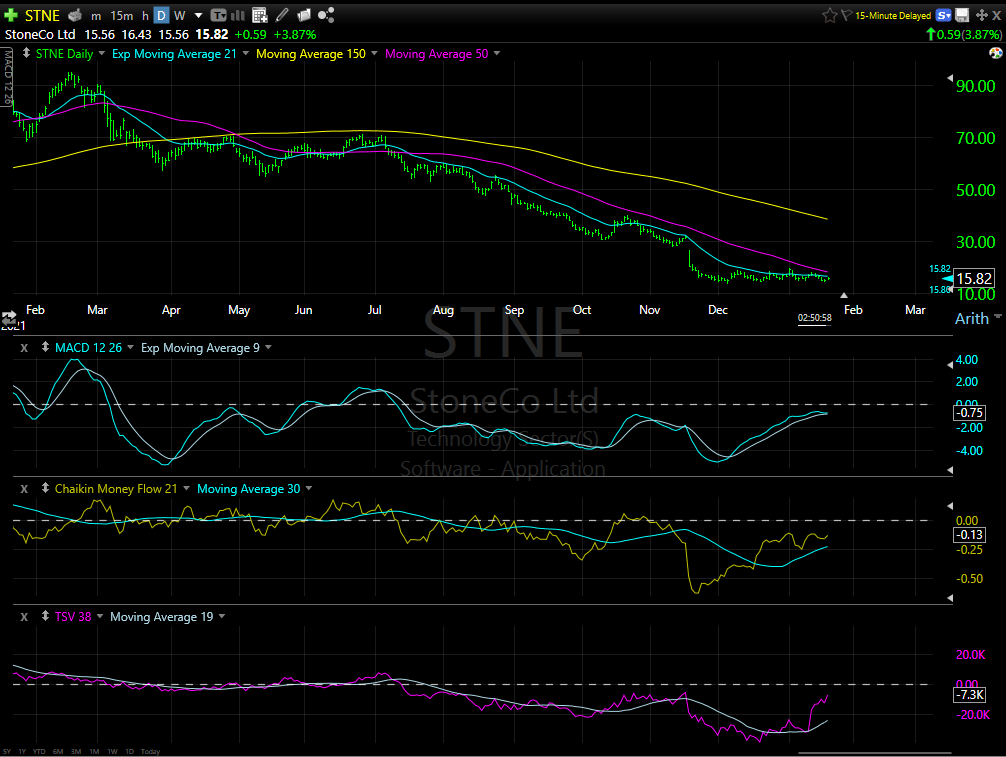
- Notice the “Flat Line” price action in the share price from the late November period until today.
Flay Line price action only happens if a buyer of size is sitting in the stock buying at a certain price area but not willing to pay more than a certain price. Hence the Flat line. It could be that they even sell or short the shares to hold the price down because they have not purchased their target purchase amount. One of two things usually happen.
- The first is that the buyer runs out of money while there are still sellers who want to exit their position. If this happens the stock price would go lower than the Flat-line accumulation zone.
- The second is, others detect the buying, and this draws in more buyers and the price completes its base building and begins a new leg higher. We hope or would like to see a second catalyst like news or a buy-out offer that also draws in additional buyers.
In the case of StoneCo, we know the Flat-line only looks like a Flat-line on a longer-term chart because the share price is down from $90. In reality the flat-line is a tight trading range between $14 and $18.
- Moving on from the price action, we can see the 50-day moving average is getting closer to the share price. It would not take much action for the price to rally above the 50-day moving average and trigger algo buying on the crossover of price on the 50-day MA.
- MACD is rising suggesting share action is basing or in rally mode. We are now assuming the stock price is in a basing stage one pattern
- CMF is rising telling us the size of the buying trades are larger than the selling trades.
- TSV or Time Segmented Volume tell us the same. More shares being bought than sold – accumulation.
Our conclusion is that the risk of lower prices than $15 has been reduced. The downside momentum has stopped. Upside momentum does has not buying at this time to begin a new uptrend.
As for the stock we would use this base to accumulate share in a slow but methodical process. Once news is out (potential buy-out – Earnings report that is constructive) the share price can be bought (probably at higher prices) more aggressively. Here is where it is important to know yourself. Either you want to buy into lower prices or you like buying into upward momentum at higher prices. In the latter case, you are concerned about time more than range of profit. Neither is right or wrong – simply what fits your needs and personality.
A competitor to StoneCo in Brazil is shown in the chart below. Accounts related to LOTM own both STNE and PAGS. The chart below is a comp to STNE. An account related to PAGS bought shares of PAGS yesterday adding to an existing position.
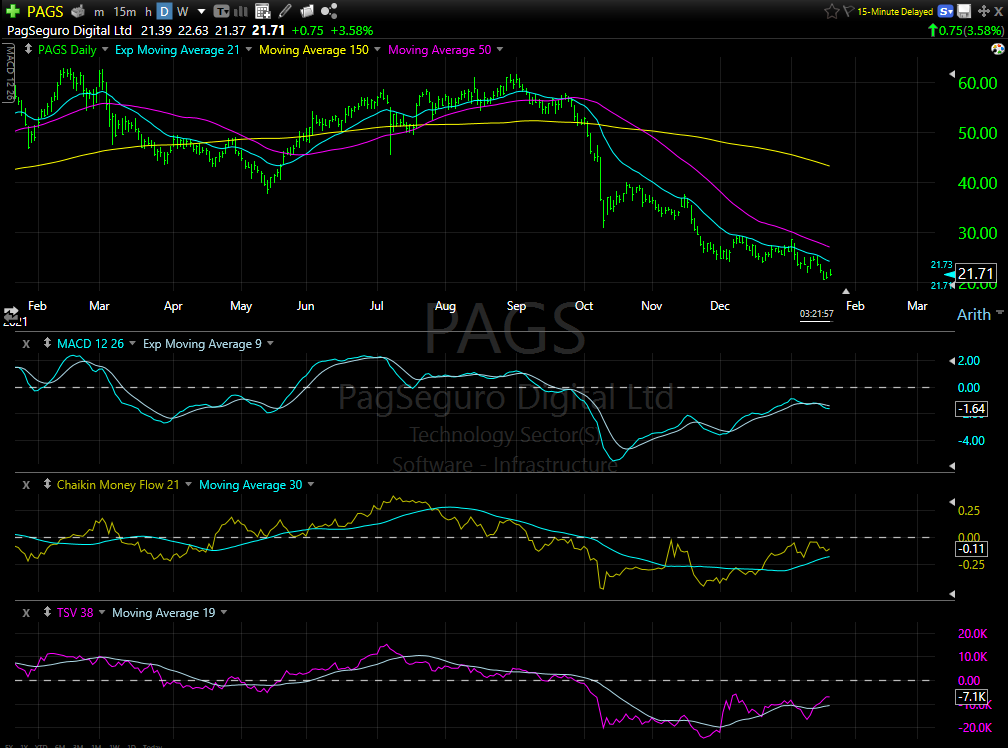
You can clearly see PAGS does not have the same type of buying happening as does STNE. There is no Flat Line pattern. Even though PAGS has up-trend in CMF and TSV, the price is not signaling the low has been established.
You can Read, you can watch Videos, but nothing beats Personal Interaction for accelerated learning.
This game has levels of understanding that could take a lifetime of Trial and Error to learn.
Available for Coaching, Training or Mentorships
Contact Tom through the LOTM website or by email
Rate: $150 per hour / Monthly Retainer, Lowers Rate
LOTM Research & Consulting Service
* An account related to LOTM holds a position in this security.
Neither LOTM nor Tom Linzmeier is a Registered Investment Advisor.
Please refer to our web site for full disclosure at www.LivingOffTheMarket.com ZTA Capital Group, Inc.
To Unsubscribe please select “return” and type Unsubscribe in the subject line.
![]()