
We like this stock as a trader and investment – though as an investment, it is so volatile, we think you should trade it or dollar cost average in the position. It is too volatile in our opinion to be sniping a purchase and a sale.
Q1 of each year is traditionally, but not always, a strong quarter for gold prices.
In addition, a US stimulus program is likely in Q1, 2021. Silver and gold love low interest rates combined with a stimulus plan.
- This stock has dropped from $38.50 area in the first week of August.
- Yet – Earnings are very strong with forward P/E ratio around 6.67. Really? They are generating cash like they own the press.
- TipRanks.com has the shares with two buys / no sells and a $37 price target in the next twelve months.
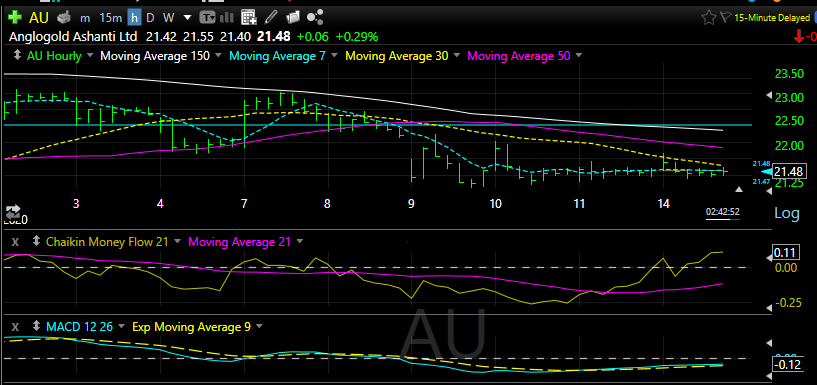
- Note the flat line pricing in the black chart below. This is an hourly chart. I LOVE flat lines like this. It does not mean the stock is going up, but it does mean someone big has a bid in for shares at a certain price. Obviously, they think the stock is a good price or going up.
- Also note the Chaikin Money Flow (CMF), the size of trade on an up-tick or down-tick. A rising yellow line Vs its purple moving average, tells me the bigger trades are buying on up-ticks in the shares. This is often a directional front runner to the stock price’s movement.
In all fairness, I also said the same in the $28 to $32 area at times, between August and today. And I was wrong. The price went lower. Remember what I said about liking the shares longer-term? Well, I have been slowly dollar-cost averaging so none of my purchases have been big – 100 shares here, 50 share there, maybe 200 shares. So, I am building a position in AU as opposed to trading. I am still underwater, with a cost around $24…but when this stock moves – it BLOWS UP – and of course down. At 6.7 times next year’s earnings and the profit margin they have, I am not too worried. I bought 50 more shares today. In related accounts, we now have about 1300 shares.
Finviz: Chart, Stats, News& Analyst opinion linked here
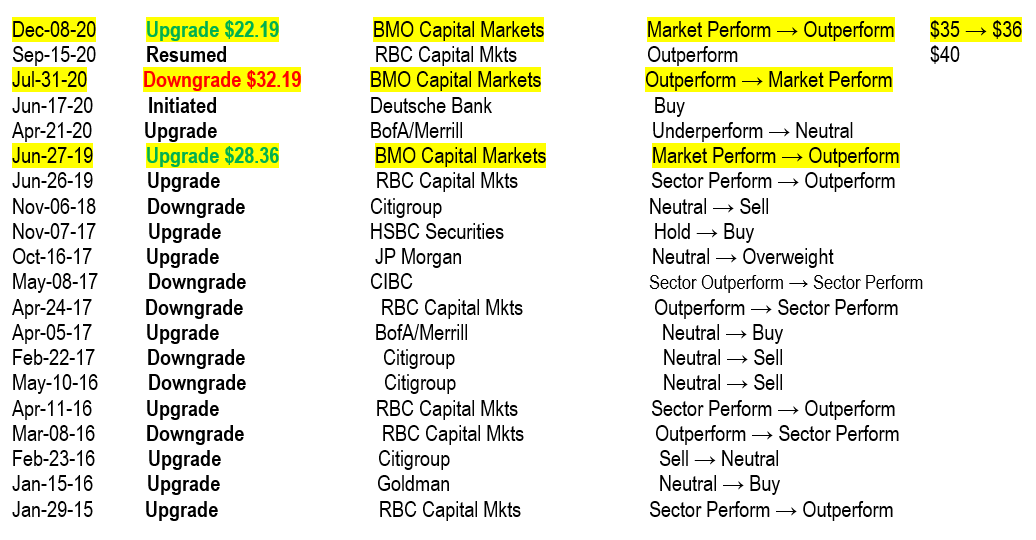
COMMENT – BMO seems to be picking the highs and lows pretty good.
From Finviz.com:
 On a daily chart the shares look like this:
Where Value meets Buy Signals!
Feel free to forward or recommend to others.
* An account related to LOTM holds a position in this security.
Neither LOTM nor Tom Linzmeier is a Registered Investment Advisor.
Please refer to our web site for full disclosure at www.LivingOffTheMarket.com ZTA Capital Group, Inc.
To Unsubscribe please select “return” and type Unsubscribe in the subject line.
![]()