
Fundamentally, these two companies have been performing in an amazing way. We will not rehash their fundament growth rates. These are posted in monthly updates or quarterly reports. The stock prices retreated along with the correction in Crypto however there isn’t a strong correlation between crypto prices rising and falling and operational performance at Galaxy Digital (BRPHF)* $18.95 or Voyager Digital (VYGVF)* $16.67
- Voyager Digital Announces Record Quarterly Revenue with Growth of over 65% from the Previous Quarter
- August 2021 Investor Presentation – PDF Link
- Galaxy Digital Presentation at Morgan Stanley Fintech Conference June 14, 2021
You can review the above links to catch up on the stories but today we want to share the technical chart as visuals. At LOTM we trace a number of technical indicators. They are not proprietary, so we don’t have a reason to not share. We are as much about education say sharing ideas and making money.
Our primary indicators include:
Trend following:
- Price crossing moving averages
- Shorter-term moving averages crossing longer-term moving averages.
Leading Indicators:
- MACD (Moving Average Convergence Divergence)
- OBV (On Balance Volume)
- TSV (Time Segmented Volume)
- CMF (Chaikin Money Flow)
The leading indicators can give us false (or early) signals, so we like to see a majority of the indicators giving similar signals at the same time.
The trend following signals offer different degrees of timeliness. The price crossing moving average is a first signal with moving averages crossing longer moving averages happening after the price has moved but is now trending higher for longer-term holding periods. Reverse this for the exiting of the trade. It is the trend following signals that we like, to use for staging in and staging out. One can never be sure of shorter-term signals having follow through. There are a lot of big money game players out there to look out for.
What the signals do, is increase the probability of success of catching a trend. It is then our job to manage the losses and maximize the winners. That is the art of working the stock market.
So, I am not going to say much about the charts and signals in them. You know from above what we are looking for.
A picture is worth a thousand dollars, right? Oh – no – worth a thousand words – Sorry about that.
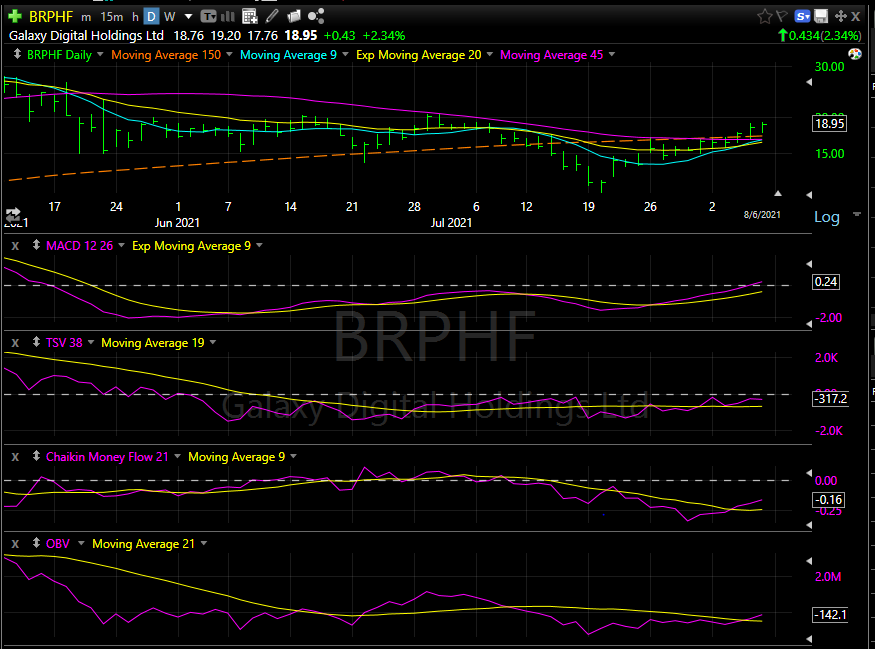
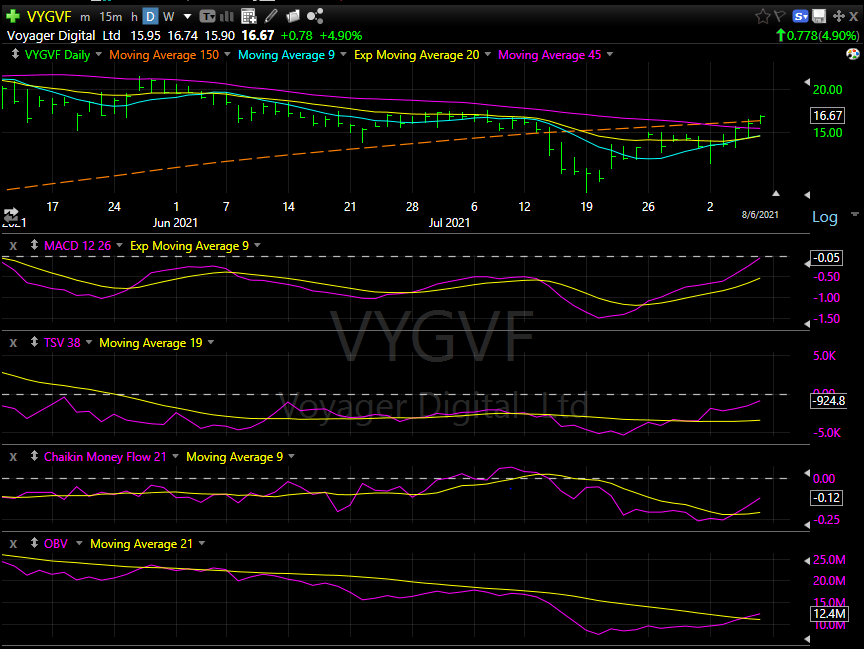
These images are as beautiful as it gets in the stock market. No guarantee that the prices will rise, but the probabilities are on your side!
Available for Coaching, Training or Mentorships
Contact Tom For One-2-One Consultations
Rate: $150 per hour / Monthly Retainer, Lowers Rate
LOTM Research & Consulting Service
Where Value meets Buy Signals!
Feel free to forward or recommend to others.
* An account related to LOTM holds a position in this security.
Neither LOTM nor Tom Linzmeier is a Registered Investment Advisor.
Please refer to our web site for full disclosure at www.LivingOffTheMarket.com ZTA Capital Group, Inc.
To Unsubscribe please select “return” and type Unsubscribe in the subject line.
![]()