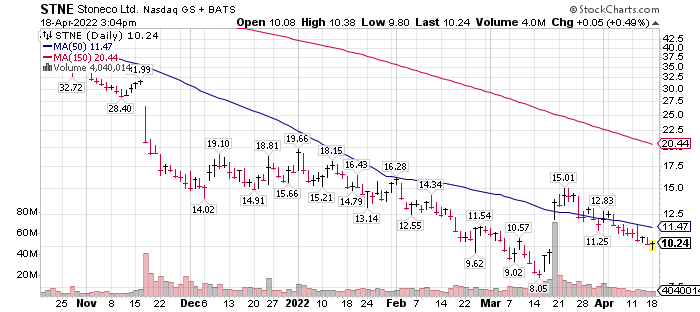
The above chart pattern off the sharp rally that started March 21 is a Flag Chart pattern. The declining price is like a flag waving in a gentle wind. This is what is called a continuation pattern and while nothing is 100%, this has a high probability to act as the launching pattern for the next and I will project, higher price than the last rally.
Duration: Flags and pennants are short-term patterns that can last from 1 to 12 weeks. There is some debate on the timeframe, and some consider 8 weeks to be pushing the limits for a reliable pattern. Ideally, these patterns will form between 1 and 4 weeks. NOTE: STNE is closing in on four weeks.
Written April 18, 2022, by Tom Linzmeier
LOTM Research & Consulting Service
* An account related to LOTM holds a position in this security.
Neither LOTM nor Tom Linzmeier is a Registered Investment Advisor.
Please refer to our web site for full disclosure at www.LivingOffTheMarket.com ZTA Capital Group, Inc.
To Unsubscribe please select “return” and type Unsubscribe in the subject line
![]()
